


| Scenario | |
|---|---|
| Timeframe | Weekly |
| Recommendation | SELL STOP |
| Entry Point | 239.40 |
| Take Profit | 218.75, 250.00 |
| Stop Loss | 255.30 |
| Key Levels | 250.00, 218.75, 250.00, 264.00, 181.25, 312.50 |
| Alternative scenario | |
|---|---|
| Recommendation | BUY STOP |
| Entry Point | 264.00 |
| Take Profit | 181.25, 312.50 |
| Stop Loss | 251.50 |
| Key Levels | 250.00, 218.75, 250.00, 264.00, 181.25, 312.50 |
Current trend
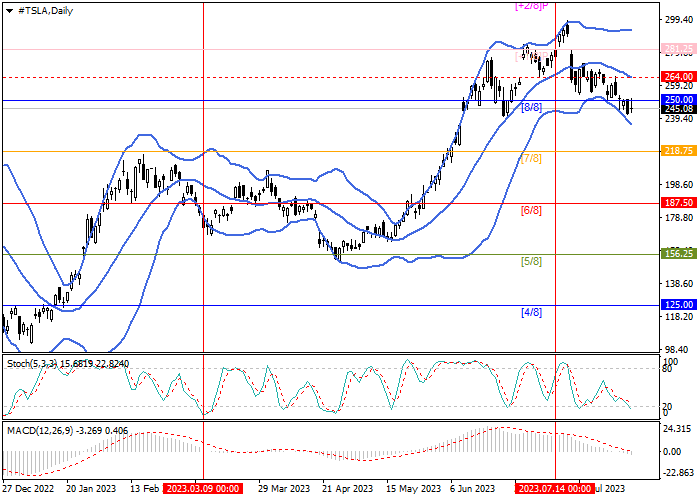
Shares of Tesla Inc., the world's leading manufacturer of electric cars, have continued to decline since the second half of last month, correcting against the mid-term upward trend.
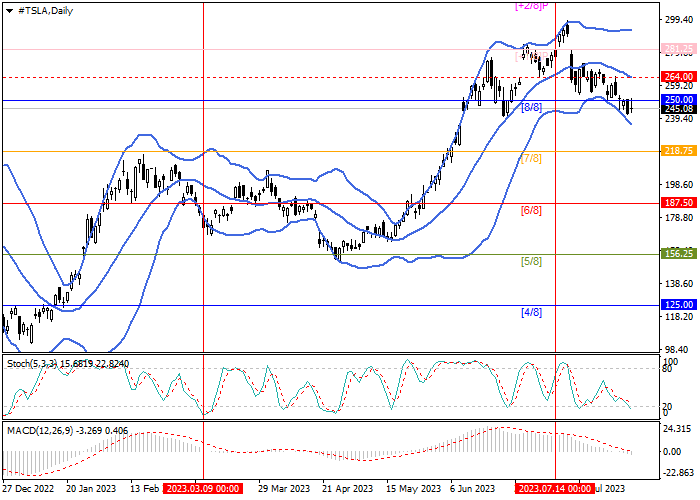
During this time, the price reversed in the upper zone and returned to the main trading range, breaking the 250.00 mark (Murray level [8/8]). Further targets for the decline may be 218.75 (Murray level [7/8]) and 187.50 (Murray level [6/8]). If the level of 250.00 is broken out again, as well as the middle line of the Bollinger Bands (264.00), the quotes will be able to reach the area of 312.50 (Murray level [ 2/8]).
Technical indicators point out the continuation of a short-term downward trend: the Bollinger Bands and the Stochastic are directed downwards, the MACD histogram increases in the negative zone.
Support and resistance
Resistance levels: 250.00, 264.00, 181.25, 312.50.
Support levels: 218.75, 250.00.
Trading tips
Short positions can be opened from 239.40 with targets at 218.75, 250.00 and stop-loss at 255.30. Implementation period: 5-7 days.
Long positions can be opened above 264.00 with targets at 181.25, 312.50 and stop-loss at 251.50.
면책 조항: 본 게시글에 표현된 견해는 전적으로 작성자의 견해이며 Followme의 공식 입장을 대변하지 않습니다. Followme는 제공된 정보의 정확성, 완전성 또는 신뢰성에 대해 책임을 지지 않으며, 서면으로 명시적으로 언급되지 않는 한 해당 내용을 기반으로 취해진 어떠한 조치에 대해서도 책임을 지지 않습니다.

