| Scenario | |
|---|---|
| Timeframe | Weekly |
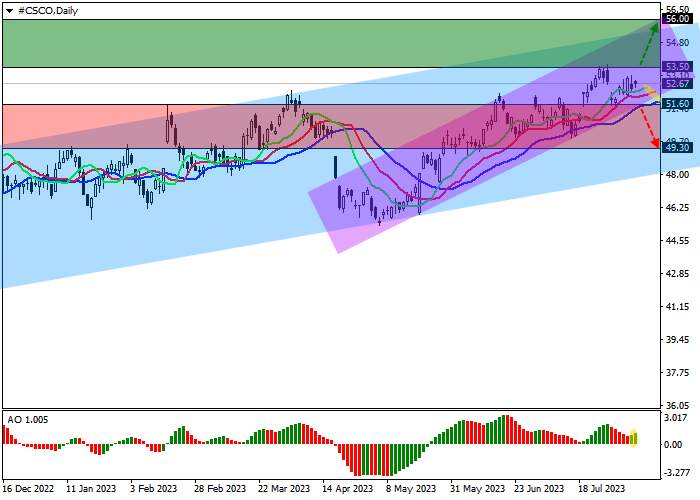
| Recommendation | BUY STOP |
| Entry Point | 53.50 |
| Take Profit | 56.00 |
| Stop Loss | 52.50 |
| Key Levels | 48.00, 49.30, 51.00, 52.00, 52.50, 53.00, 56.00 |
| Alternative scenario | |
|---|---|
| Recommendation | SELL STOP |
| Entry Point | 51.60 |
| Take Profit | 49.30 |
| Stop Loss | 52.50 |
| Key Levels | 48.00, 49.30, 51.00, 52.00, 52.50, 53.00, 56.00 |
Shares of Cisco Systems Inc., an American manufacturer and supplier of network equipment for large holdings and telecommunications companies, are correcting at 53.00.
On the daily chart, the price is rising towards the resistance line of the global ascending channel with dynamic boundaries 48.00–56.00.
On the four-hour chart, the potential for strengthening the upward dynamics remains, which confirms the development of a local corridor with the boundaries of 52.00–56.00, which is one of the growth waves. The scenario with the opening of short positions will become relevant when the quotes of the trading instrument consolidate below the support line at 51.00.
Technical indicators maintain a steady buy signal: fast EMAs on the Alligator indicator are well above the signal line, and the AO oscillator histogram is forming new ascending bars and rising in the buy zone.

Trading tips
Long positions should be opened after the price consolidates above the local resistance of 53.50 with the target of 56.00. Stop-loss — 52.50. Implementation time: 7 days and more.
Short positions can be opened after a reversal and local decline in the asset, as well as consolidation of the price below the local support level of 51.60 with the target of 49.30. Stop-loss — 52.50.
면책 조항: 본 게시글에 표현된 견해는 전적으로 작성자의 견해이며 Followme의 공식 입장을 대변하지 않습니다. Followme는 제공된 정보의 정확성, 완전성 또는 신뢰성에 대해 책임을 지지 않으며, 서면으로 명시적으로 언급되지 않는 한 해당 내용을 기반으로 취해진 어떠한 조치에 대해서도 책임을 지지 않습니다.

더 오래된 의견은 없습니다. 소파를 가장 먼저 잡으십시오.