| Scenario | |
|---|---|
| Timeframe | Weekly |
| Recommendation | SELL STOP |
| Entry Point | 32.40 |
| Take Profit | 27.20 |
| Stop Loss | 34.00 |
| Key Levels | 27.00, 27.20, 32.00, 32.40, 34.00, 36.00, 40.30 |
| Alternative scenario | |
|---|---|
| Recommendation | BUY STOP |
| Entry Point | 36.00 |
| Take Profit | 40.30 |
| Stop Loss | 34.00 |
| Key Levels | 27.00, 27.20, 32.00, 32.40, 34.00, 36.00, 40.30 |
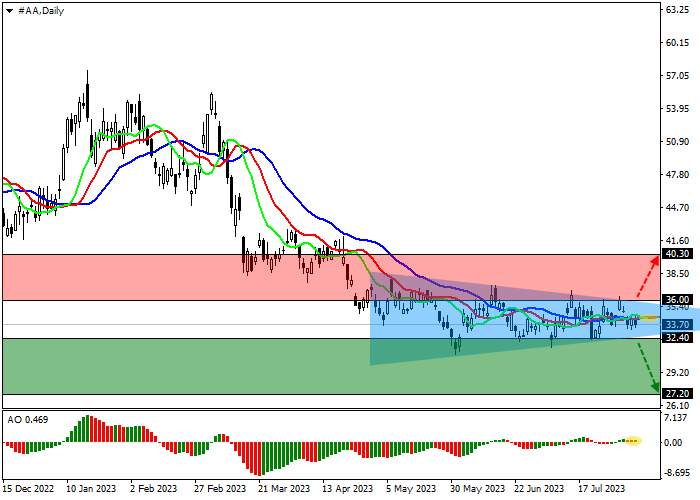
Shares of Alcoa Corp., one of the world's largest aluminum producers, are trading at 33.00.
On the daily chart, the price is holding within the global downtrend, again approaching the annual lows around 32.00.
On the four-hour chart, after several unsuccessful attempts to test the level of 32.00, the quotes formed a local Triangle pattern with dynamically narrowing boundaries at 36.00–32.40, in case of which the downward dynamics may increase to the level of 27.00.
Technical indicators maintain an unclear sell signal: the range of fluctuations of the EMA on the Alligator indicator remains narrowed, and the histogram of the AO oscillator, being in the sell zone, continues to form corrective bars.

Trading tips
Short positions can be opened after a continued decline in the asset, as well as price consolidation below the global low at 32.40 with the target of 27.20. Stop-loss — 34.00. Implementation time: 7 days and more.
Long positions should be opened after the price reverses and consolidates above the level of 36.00 with a target of 40.30. Stop-loss – 34.00.
면책 조항: 본 게시글에 표현된 견해는 전적으로 작성자의 견해이며 Followme의 공식 입장을 대변하지 않습니다. Followme는 제공된 정보의 정확성, 완전성 또는 신뢰성에 대해 책임을 지지 않으며, 서면으로 명시적으로 언급되지 않는 한 해당 내용을 기반으로 취해진 어떠한 조치에 대해서도 책임을 지지 않습니다.

더 오래된 의견은 없습니다. 소파를 가장 먼저 잡으십시오.