


· Views 105
면책 조항: 본 게시글에 표현된 견해는 전적으로 작성자의 견해이며 Followme의 공식 입장을 대변하지 않습니다. Followme는 제공된 정보의 정확성, 완전성 또는 신뢰성에 대해 책임을 지지 않으며, 서면으로 명시적으로 언급되지 않는 한 해당 내용을 기반으로 취해진 어떠한 조치에 대해서도 책임을 지지 않습니다.
이 글이 마음에 드시나요? 작성자에게 팁을 보내 감사의 마음을 전하세요.
| Scenario | |
|---|---|
| Timeframe | Weekly |
| Recommendation | BUY STOP |
| Entry Point | 143.80 |
| Take Profit | 145.31, 146.87, 148.50 |
| Stop Loss | 142.60 |
| Key Levels | 135.93, 137.50, 140.62, 143.75, 145.31, 146.87, 148.50 |
| Alternative scenario | |
|---|---|
| Recommendation | SELL STOP |
| Entry Point | 140.60 |
| Take Profit | 137.50, 135.93 |
| Stop Loss | 142.00 |
| Key Levels | 135.93, 137.50, 140.62, 143.75, 145.31, 146.87, 148.50 |
Current trend
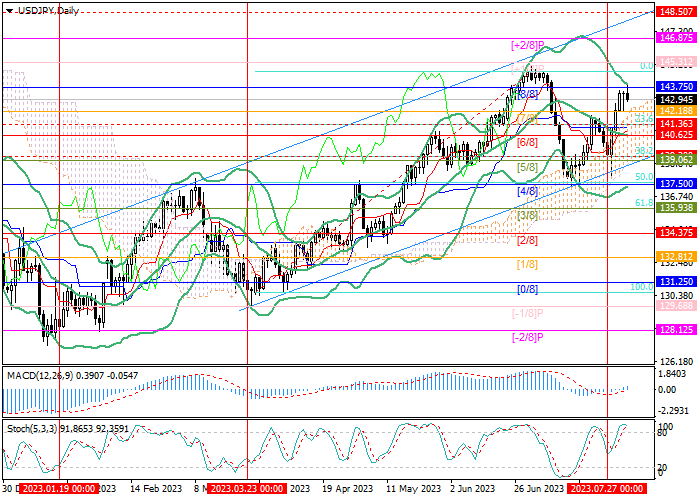
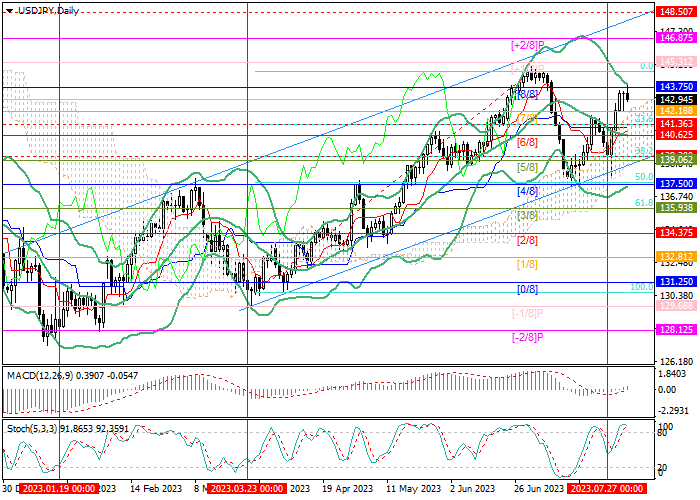
The USD/JPY pair is moving within a long-term upward channel. Last week, the price tested its lower border around 138.40 but could not consolidate below it and resumed growth.
Currently, the quotes are testing 143.75 (Murrey level [8/8]), which breakout allows them to reach 145.31 (Murrey level [ 1/8]) and 146.87 (Murrey level [ 2/8]) and 148.50 (the upper limit of the ascending channel). The key “bearish” level is 140.62 (Murrey level [6/8]), supported by the middle line of Bollinger bands. After its breakdown, the decline may continue to 137.50 (Murrey level [4/8], Fibonacci correction 50.0%) and 135.93 (Murrey level [3/8], Fibonacci retracement 61.8%).
Technical indicators do not give a single signal: Bollinger bands are directed downwards, Stochastic has reached the overbought zone and may reverse downwards but the MACD histogram is increasing in the positive zone.
Support and resistance
Resistance levels: 143.75, 145.31, 146.87, 148.50.
Support levels: 140.62, 137.50, 135.93.
Trading tips
Long positions may be opened above 143.75 with the targets at 145.31, 146.87, 148.50, and stop loss around 142.60. Implementation period: 5–7 days.
Short positions may be opened below 140.62 with the targets at 137.50, 135.93, and stop loss around 142.00.
면책 조항: 본 게시글에 표현된 견해는 전적으로 작성자의 견해이며 Followme의 공식 입장을 대변하지 않습니다. Followme는 제공된 정보의 정확성, 완전성 또는 신뢰성에 대해 책임을 지지 않으며, 서면으로 명시적으로 언급되지 않는 한 해당 내용을 기반으로 취해진 어떠한 조치에 대해서도 책임을 지지 않습니다.

