


Scenario Timeframe Weekly Recommendation BUY STOP Entry Point 83.30 Take Profit 88.10 Stop Loss 80.00 Key Levels 76.00, 80.10, 83.30, 88.10
Alternative scenario Recommendation SELL STOP Entry Point 80.10 Take Profit 76.00 Stop Loss 82.00 Key Levels 76.00, 80.10, 83.30, 88.10
Current trend
The price of North American WTI Crude Oil is correcting in an uptrend at 81.80 amid the decision of OPEC to voluntarily reduce production from May until the end of the year in a total volume of about 1.66 million barrels per day, taking into account the share of Russia, which began to reduce production of 500.0 thousand barrels per day since March. This decision of the countries of the alliance was called a preventive measure to maintain market stability.
At the moment, Bloomberg experts predict a larger supply shortage of "black gold", which in the second half of the year can reach 1.2 million tons. Against this background, Russian Urals oil is in increasing demand from buyers, the price of which again set a historical record, reaching 64.3 dollars per barrel, exceeding the 60.0 dollars limit introduced by the European and Australian authorities, as well as the G7 countries after the start of the Russian-Ukrainian military conflict.
In turn, this week, energy stocks in the US are once again breaking records of decline. According to the American Petroleum Institute (API), the indicator fell by 15.400 million barrels, which is significantly lower than the expected reduction of 0.900 million barrels. Today the report of the Energy Information Administration (EIA) of the US Department of Energy will be published: the indicator is predicted at the level of -1.367 million barrels. If the actual data indicates a significant reduction, one can expect continued growth in asset quotes on the market.
Support and resistance
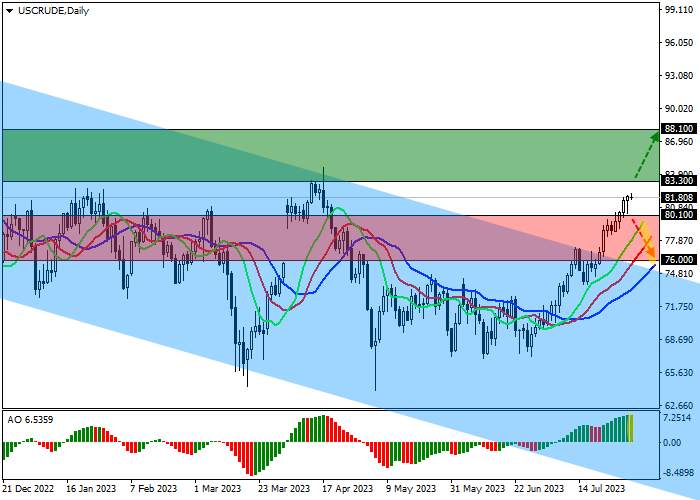
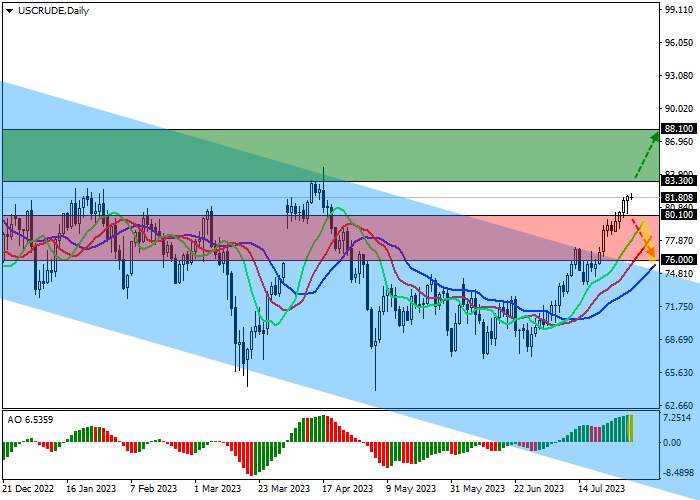
On the daily chart, the price marked an exit from the global channel with dynamic boundaries 60.00–76.00 and is now holding above the resistance line.
Technical indicators are rising, holding a stable buy signal: the fast EMAs on the Alligator indicator keep the fluctuation range directed upwards, and the AO histogram is forming new ascending bars, rising in the buying zone.
Support levels: 80.10, 76.00.
Resistance levels: 83.30, 88.10.
Trading tips
If the asset continues growing and the price consolidates above the local resistance level of 83.30, long positions will be relevant with target at 88.10. Stop-loss — 80.00. Implementation time: 7 days and more.
If the asset continues local decline and the price consolidates below the local support level at 80.10, short positions can be opened with the target at 76.00. Stop-loss — 82.00.
| Scenario | |
|---|---|
| Timeframe | Weekly |
| Recommendation | BUY STOP |
| Entry Point | 83.30 |
| Take Profit | 88.10 |
| Stop Loss | 80.00 |
| Key Levels | 76.00, 80.10, 83.30, 88.10 |
| Alternative scenario | |
|---|---|
| Recommendation | SELL STOP |
| Entry Point | 80.10 |
| Take Profit | 76.00 |
| Stop Loss | 82.00 |
| Key Levels | 76.00, 80.10, 83.30, 88.10 |
Current trend
The price of North American WTI Crude Oil is correcting in an uptrend at 81.80 amid the decision of OPEC to voluntarily reduce production from May until the end of the year in a total volume of about 1.66 million barrels per day, taking into account the share of Russia, which began to reduce production of 500.0 thousand barrels per day since March. This decision of the countries of the alliance was called a preventive measure to maintain market stability.
At the moment, Bloomberg experts predict a larger supply shortage of "black gold", which in the second half of the year can reach 1.2 million tons. Against this background, Russian Urals oil is in increasing demand from buyers, the price of which again set a historical record, reaching 64.3 dollars per barrel, exceeding the 60.0 dollars limit introduced by the European and Australian authorities, as well as the G7 countries after the start of the Russian-Ukrainian military conflict.
In turn, this week, energy stocks in the US are once again breaking records of decline. According to the American Petroleum Institute (API), the indicator fell by 15.400 million barrels, which is significantly lower than the expected reduction of 0.900 million barrels. Today the report of the Energy Information Administration (EIA) of the US Department of Energy will be published: the indicator is predicted at the level of -1.367 million barrels. If the actual data indicates a significant reduction, one can expect continued growth in asset quotes on the market.
Support and resistance
On the daily chart, the price marked an exit from the global channel with dynamic boundaries 60.00–76.00 and is now holding above the resistance line.
Technical indicators are rising, holding a stable buy signal: the fast EMAs on the Alligator indicator keep the fluctuation range directed upwards, and the AO histogram is forming new ascending bars, rising in the buying zone.
Support levels: 80.10, 76.00.
Resistance levels: 83.30, 88.10.
Trading tips
If the asset continues growing and the price consolidates above the local resistance level of 83.30, long positions will be relevant with target at 88.10. Stop-loss — 80.00. Implementation time: 7 days and more.
If the asset continues local decline and the price consolidates below the local support level at 80.10, short positions can be opened with the target at 76.00. Stop-loss — 82.00.
면책 조항: 본 게시글에 표현된 견해는 전적으로 작성자의 견해이며 Followme의 공식 입장을 대변하지 않습니다. Followme는 제공된 정보의 정확성, 완전성 또는 신뢰성에 대해 책임을 지지 않으며, 서면으로 명시적으로 언급되지 않는 한 해당 내용을 기반으로 취해진 어떠한 조치에 대해서도 책임을 지지 않습니다.
더 오래된 의견은 없습니다. 소파를 가장 먼저 잡으십시오.