


| Scenario | |
|---|---|
| Timeframe | Intraday |
| Recommendation | SELL STOP |
| Entry Point | 137.50 |
| Take Profit | 135.57 |
| Stop Loss | 138.50 |
| Key Levels | 135.57, 136.50, 137.50, 138.50, 139.35, 140.50, 141.50, 142.54 |
| Alternative scenario | |
|---|---|
| Recommendation | BUY STOP |
| Entry Point | 139.35 |
| Take Profit | 141.50 |
| Stop Loss | 138.30 |
| Key Levels | 135.57, 136.50, 137.50, 138.50, 139.35, 140.50, 141.50, 142.54 |
Current trend
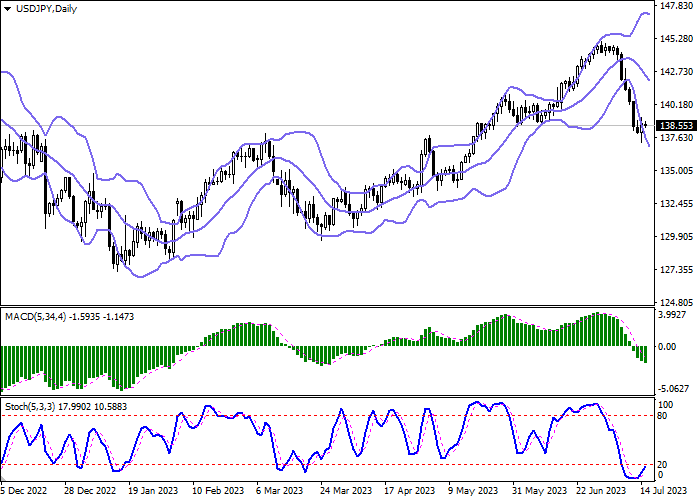
The USD/JPY pair shows mixed dynamics, consolidating near 138.60. The instrument is trying to develop the upward momentum of July 14; however, there are not enough drivers for further growth at the moment.
The positions of the American currency are still under pressure due to the approaching completion of the cycle of tightening monetary policy by the US Federal Reserve. The market reaction to the positive inflation data in June is weakening, and now investors are following the comments of regulator officials regarding the current economic situation and their further actions. Representatives of the Fed positively assessed the slowdown in consumer prices; however, the President of the Federal Reserve Bank (FRB) of San Francisco, Mary Daly, confirmed her readiness to approve two more interest rate increases this year, and Christopher Waller, a member of the Board of Governors of the US Federal Reserve, said that he expects adjustment in the rate in July, and then another one before the end of the year. After that, it can be expected that the regulator will take a break and look for the right moment to start the reverse process of launching a cycle of monetary easing.
The pressure on the yen, in turn, is exerted by macroeconomic statistics from Japan, which does not allow the country's central bank to abandon the policy of negative rates. In particular, published on Friday, July 14, May data reflected a decline in Industrial Production by 2.2% after -1.6% in the previous month, while analysts expected the same dynamics to remain at the level of -1.6%, and in annual terms the indicator decreased from 4.7% to 4.2%. Capacity Utilization was -6.3% after 3.0% a month earlier, while experts expected only -2.5%.
Support and resistance
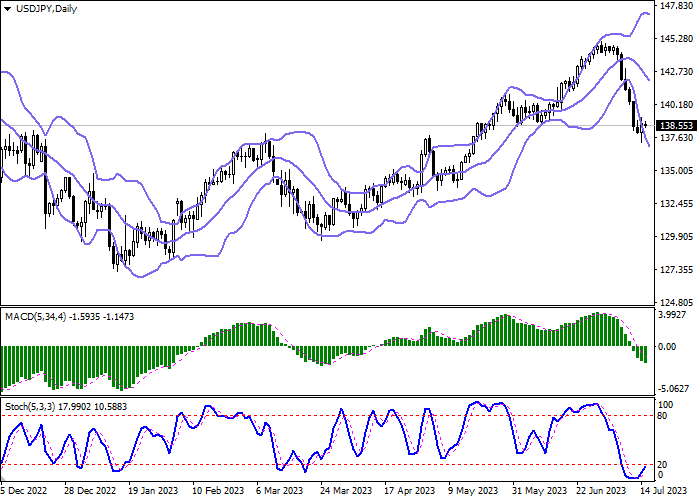
Bollinger Bands on the daily chart show a steady decline. The price range expands from below, making way for new local lows for the "bears". MACD is going down preserving a stable sell signal (located below the signal line). Stochastic, having shown a rebound from zero, reversed into an upward plane, signaling the risks of corrective growth in the ultra-short term.
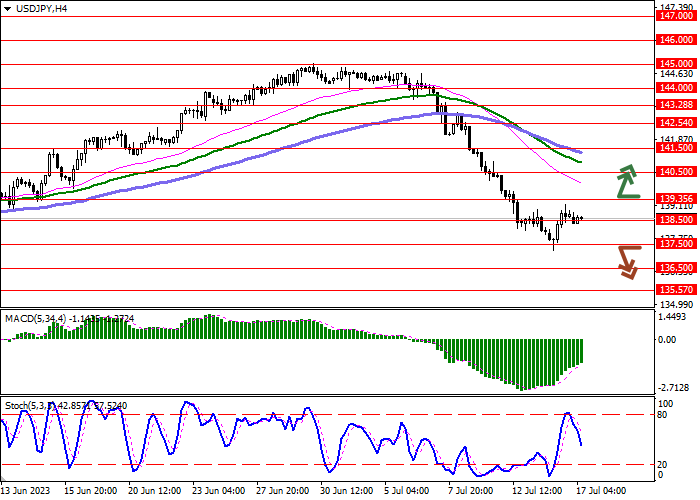
Resistance levels: 139.35, 140.50, 141.50, 142.54.
Support levels: 138.50, 137.50, 136.50, 135.57.
Trading tips
Short positions may be opened after a breakdown of 137.50 with the target at 135.57. Stop-loss — 138.50. Implementation time: 2-3 days.
The return of the "bullish" trend with the breakout of 139.35 may become a signal for new purchases with the target of 141.50. Stop-loss — 138.30.
면책 조항: 본 게시글에 표현된 견해는 전적으로 작성자의 견해이며 Followme의 공식 입장을 대변하지 않습니다. Followme는 제공된 정보의 정확성, 완전성 또는 신뢰성에 대해 책임을 지지 않으며, 서면으로 명시적으로 언급되지 않는 한 해당 내용을 기반으로 취해진 어떠한 조치에 대해서도 책임을 지지 않습니다.

