


· Views 1,238
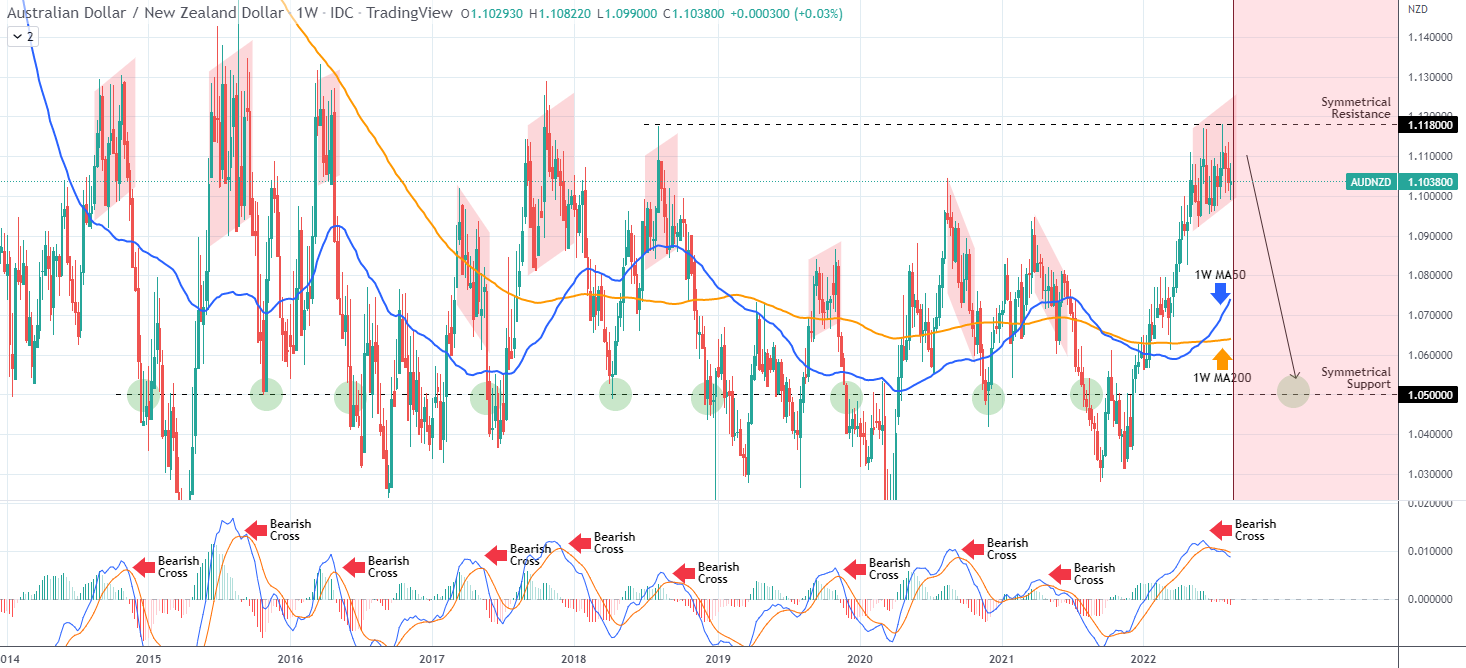
The AUDNZD pair is trading within a Channel Up since the start of May but has most likely peaked based on this unique pattern going back 8 years.
The chart is on the 1W time-frame where the MACD is trading downwards after a late June Bearish Cross. As you see, every such Bearish Cross above the 0.0 MACD level, formed a long-term Top on either a Channel Up or Down pattern since 2014. All the downtrends that followed this peak formation were sharp sell-offs that dropped to at least the 1.0500 level (symmetrical Support) even though most reached a lot lower.
As a result since we are still inside the Channel Up pattern, this could be the best place for a sell position this year. You can use three target levels: the 1W MA50 (blue trend-line) short-term, the 1W MA200 (orange trend-line) medium-term and the 1.0500 Symmetrical Support for the long-term. #OPINIONLEADER#
면책 조항: 본 게시글에 표현된 견해는 전적으로 작성자의 견해이며 Followme의 공식 입장을 대변하지 않습니다. Followme는 제공된 정보의 정확성, 완전성 또는 신뢰성에 대해 책임을 지지 않으며, 서면으로 명시적으로 언급되지 않는 한 해당 내용을 기반으로 취해진 어떠한 조치에 대해서도 책임을 지지 않습니다.
이 글이 마음에 드시나요? 작성자에게 팁을 보내 감사의 마음을 전하세요.

