


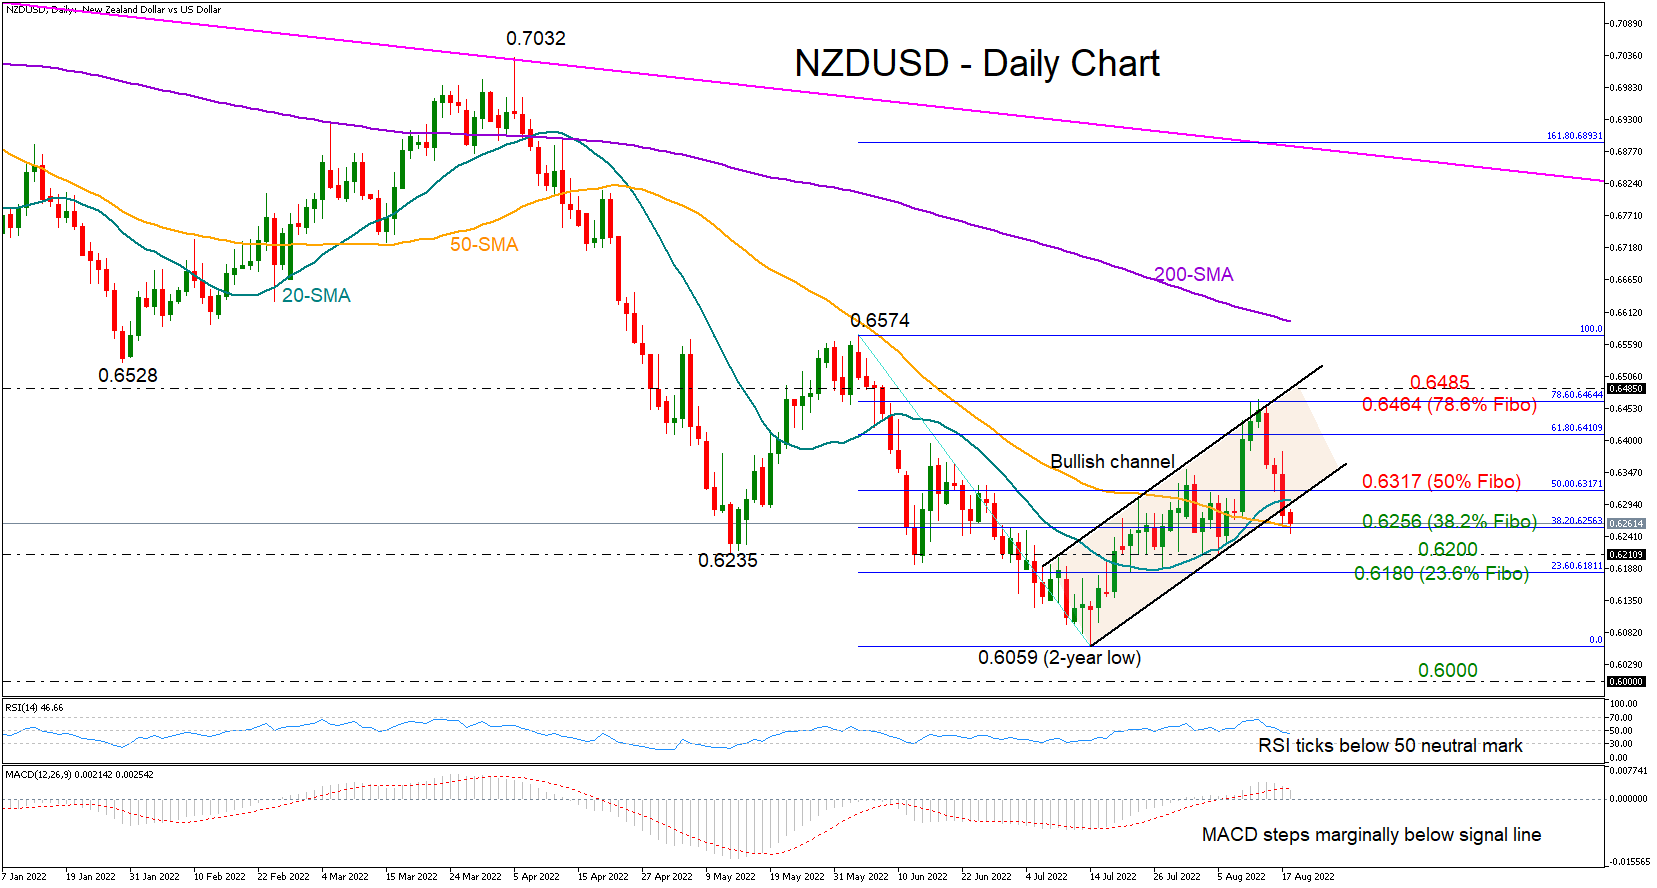
NZDUSD is in the fourth consecutive day of declines, set to confirm its exit from a short-term bullish channel at 0.6267.
While the momentum indicators suggest that the negative correction has just started, some confirmation is required since the RSI and the MACD have not significantly deviated below their neutral levels; the RSI is still close to its 50 neutral mark and the MACD marginally below its red signal line, reflecting a neutral-to-bearish short-term bias overall.
Moreover, the price itself is currently facing support around the 50-day simple moving average (SMA) and the 38.2% Fibonacci retracement of the 0.6574 – 0.6059 downfall at 0.6256. If that base holds, with the price immediately crawling back above the 50% Fibonacci of 0.6317, the bulls may again attempt to breach the 78.6% Fibonacci of 0.6464 and the channel’s upper boundary seen at 0.6485. Should they claim this zone, all attention will turn to June’s peak of 0.6574. Note that the 200-day SMA is also converging to that number.
In the event the sell-off continues, the focus will initially turn to the 0.6200 – 0.6180 region. Another defeat at this point could aggressively press the pair towards the two-year low of 0.6059, while lower, the price may chart a new lower low at 0.6000.
Summarizing, despite the quick depreciation in NZDUSD, the pair might have another opportunity to improve its fortunes at 0.6256. Otherwise, the bearish wave could gain extra legs.
면책 조항: 본 게시글에 표현된 견해는 전적으로 작성자의 견해이며 Followme의 공식 입장을 대변하지 않습니다. Followme는 제공된 정보의 정확성, 완전성 또는 신뢰성에 대해 책임을 지지 않으며, 서면으로 명시적으로 언급되지 않는 한 해당 내용을 기반으로 취해진 어떠한 조치에 대해서도 책임을 지지 않습니다.

