


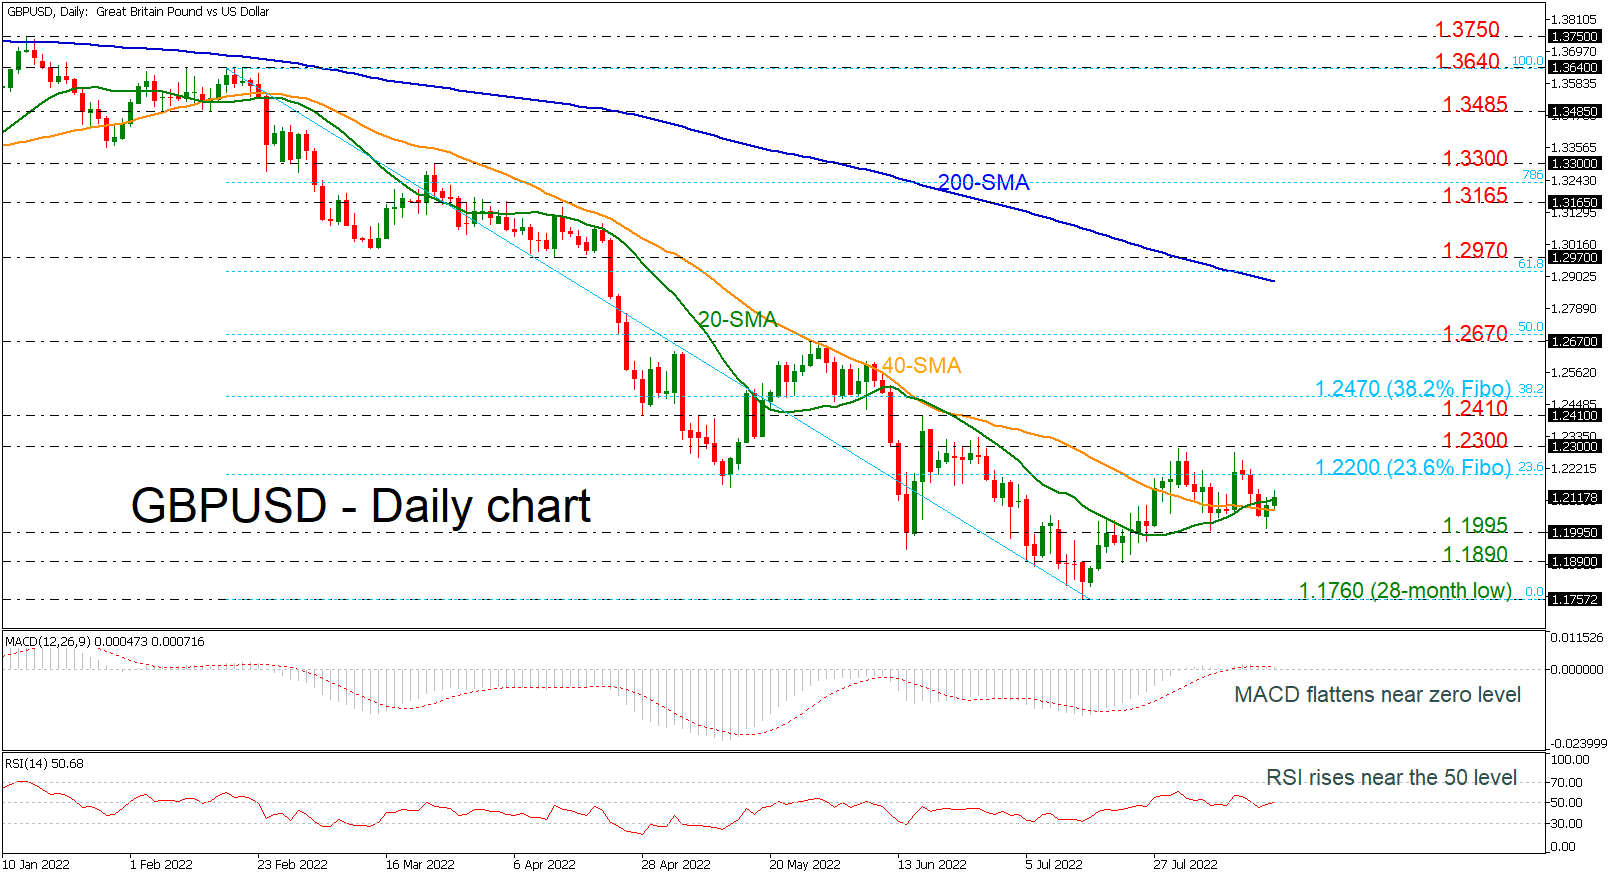
GBPUSD rebounded off the 1.2000 psychological level in the preceding session, flirting with the 20- and 40-day simple moving averages (SMAs). The bullish crossover within the SMAs remains intact, suggesting that a bullish correction may be on the radar in the short-term timeframe. The MACD oscillator is moving sideways near its trigger and zero lines, while the RSI is approaching the neutral threshold of 50.
If the market manages to gain momentum, the 23.6% Fibonacci retracement level of the decline from 1.3640 to 1.1760 at 1.2200 may act as nearby resistance ahead of the 1.2300 barrier. A sustained close above the latter may pave the way for 1.2410 and the 38.2% Fibonacci level at 1.2470.
On the other hand, a move lower again may find next support at 1.1995, a level that has acted as both resistance and support throughout the month of July and the beginning of August. When that level is broken, the next potential support is at 1.1890, after which the attention can turn to the 28-month low at 1.1760.
Since prices are still below the 1.2200 resistance, the medium-term picture is unfavorable and only a successful climb above the 200-day SMA may switch the outlook to bullish.
면책 조항: 본 게시글에 표현된 견해는 전적으로 작성자의 견해이며 Followme의 공식 입장을 대변하지 않습니다. Followme는 제공된 정보의 정확성, 완전성 또는 신뢰성에 대해 책임을 지지 않으며, 서면으로 명시적으로 언급되지 않는 한 해당 내용을 기반으로 취해진 어떠한 조치에 대해서도 책임을 지지 않습니다.

