


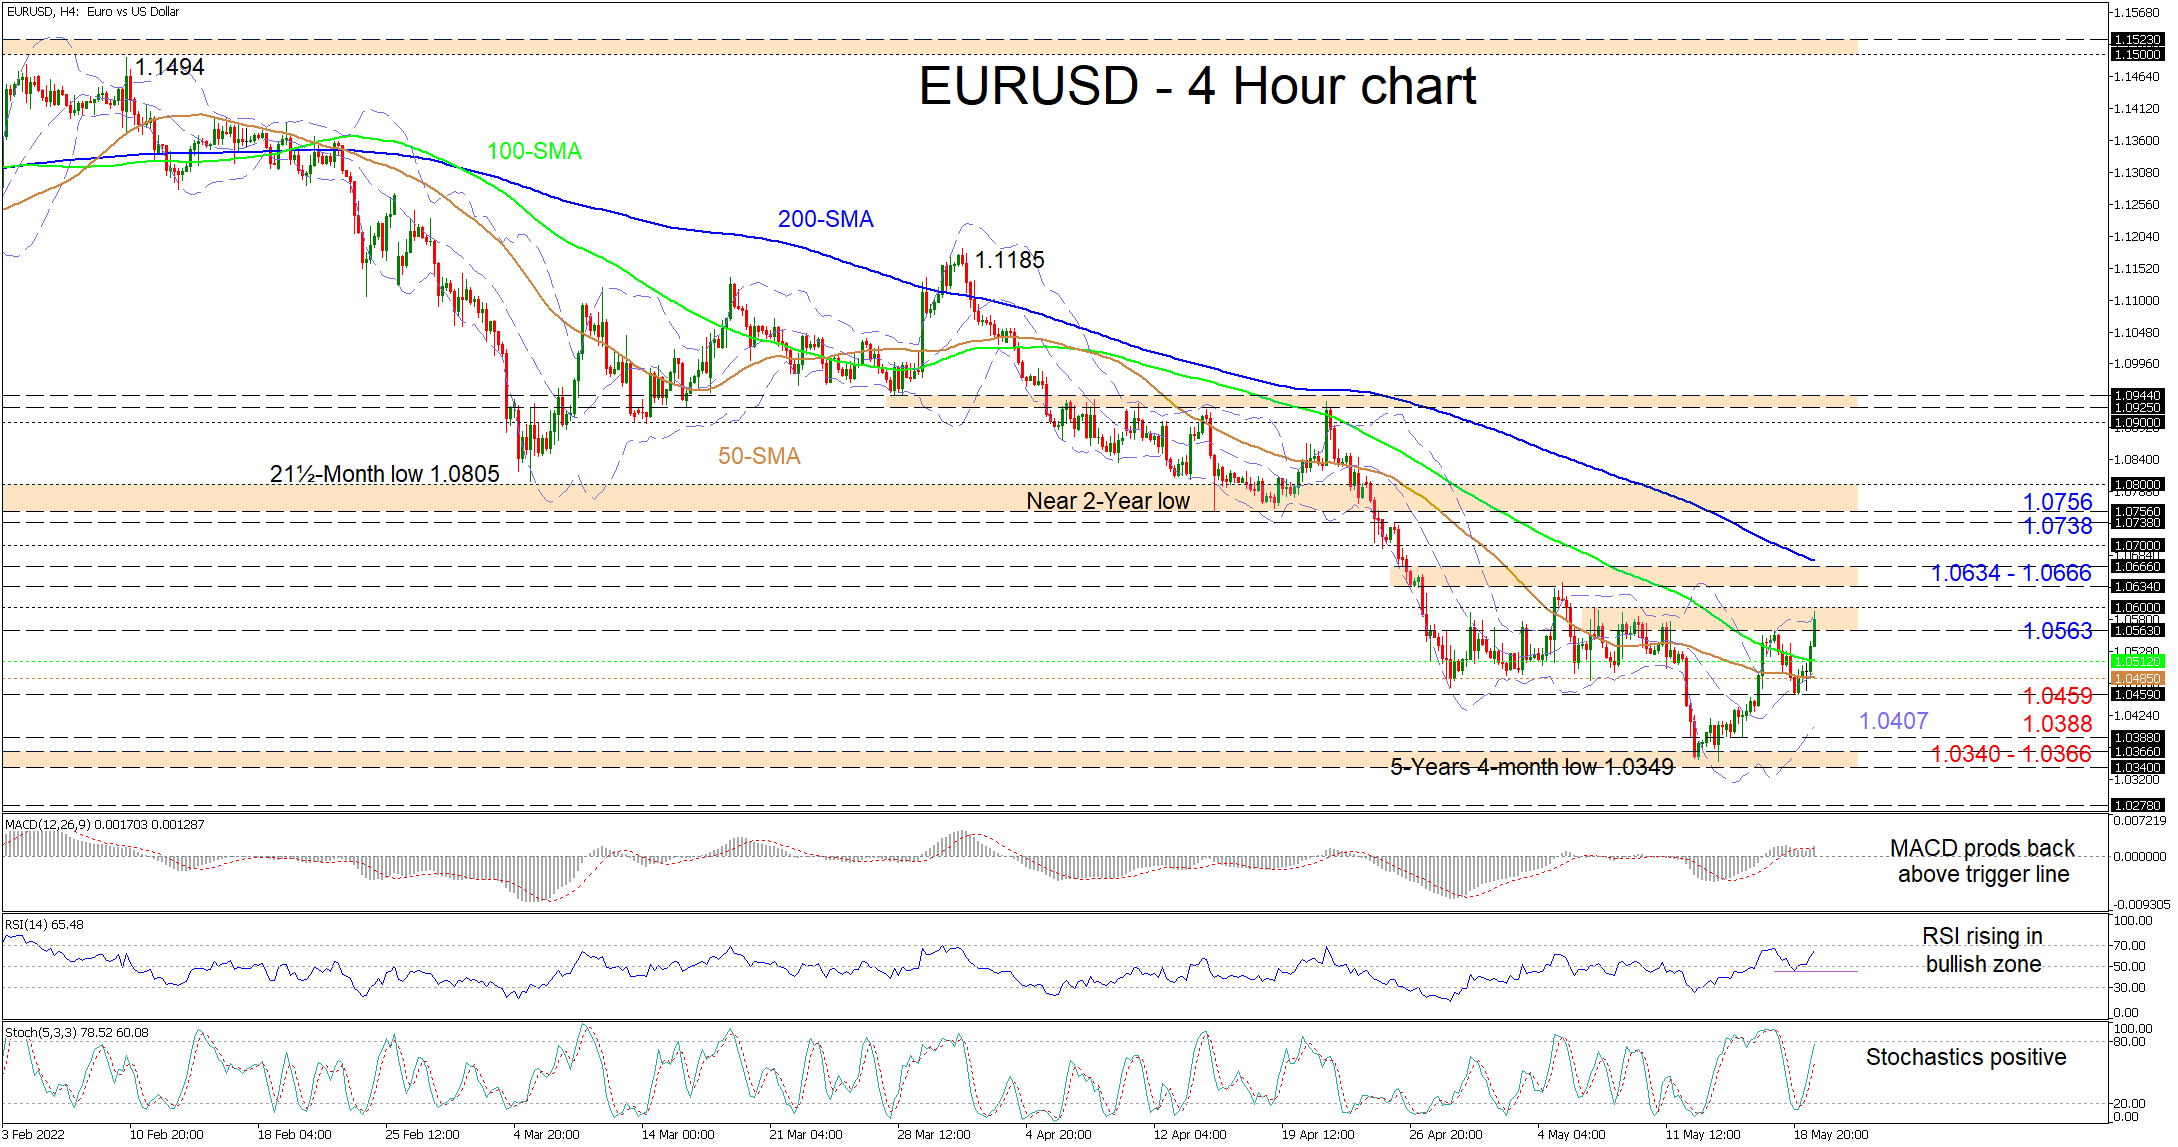
EURUSD’s fresh positive traction is struggling to surpass the upper Bollinger band residing within the 1.0563-1.0600 resistance region. Despite the pair’s newfound buoyancy extending beyond the sliding 50- and 100-period simple moving averages (SMAs), all the SMAs are promoting the bearish bearing.
The short-term oscillators have yet to reflect any clear weakness in the driving positive forces in the pair. The MACD, slightly north of the zero threshold, has lifted back above its red trigger line, while the improving RSI is heading for the 70 overbought barrier. Furthermore, the positively charged stochastic oscillator is implying that positive price action remains robust.
For the positive scenario to develop further, the bulls would need to initially climb beyond the 1.0563-1.0600 barricade, reinforced by multiple highs and the upper Bollinger band. Not much higher, the 1.0634-1.0666 obstacle and the approaching 200-period SMA overhead may try to test buyers’ efforts to overrun the 1.0700 and pilot for the 1.0738 high and the adjacent 1.0756-1.0800 resistance section that extends back to the May 2020 region of lows.
If buying pressures fade back below yesterday’s high of 1.0563, a support zone could transpire from the 100-period SMA at 1.0512 until the 50-period SMA at 1.0485. If selling interest intensifies and sinks the price past the 1.0459 border, the bears may then aim for the lower Bollinger band at 1.0407 and the 1.0388 low. Remaining heavy, the pair may revisit the 1.0340-1.0366 multi-year support region, moulded by troughs back in January 2017.
면책 조항: 본 게시글에 표현된 견해는 전적으로 작성자의 견해이며 Followme의 공식 입장을 대변하지 않습니다. Followme는 제공된 정보의 정확성, 완전성 또는 신뢰성에 대해 책임을 지지 않으며, 서면으로 명시적으로 언급되지 않는 한 해당 내용을 기반으로 취해진 어떠한 조치에 대해서도 책임을 지지 않습니다.

