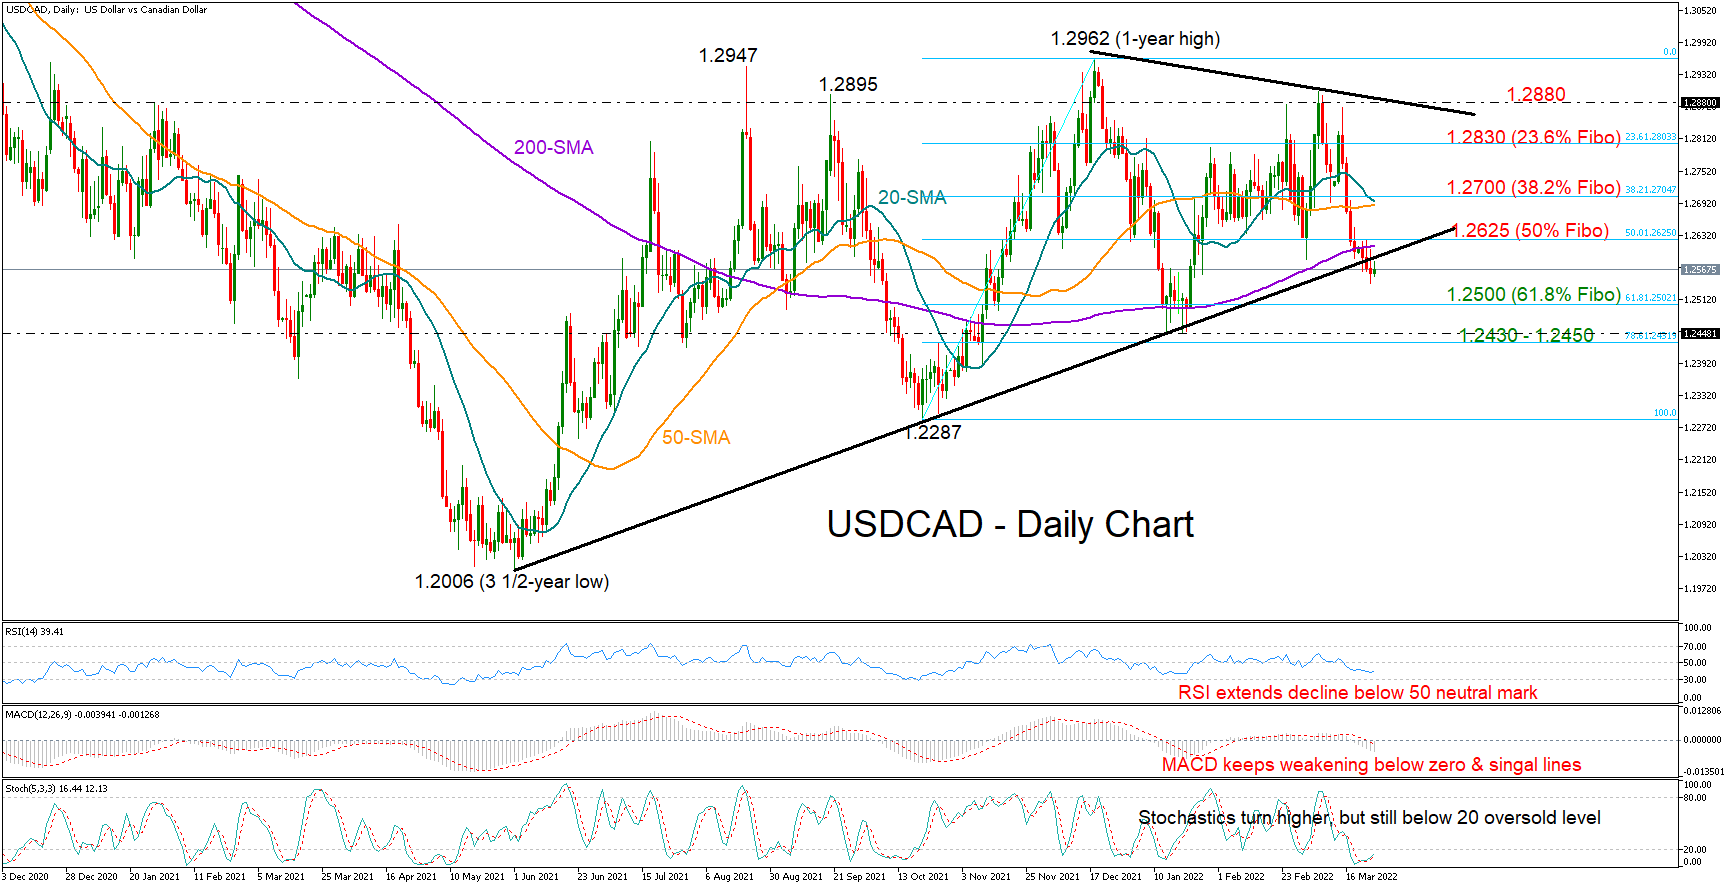
USDCAD closed marginally below the ascending trendline, which has been navigating the market since the plunge to a 3½-year low of 1.2006 in June 2021.
While the RSI has dipped further in the bearish area, and the MACD has strengthened its negative momentum below its zero and signal lines, the trendline breakout was not sizable and therefore confirmation is required before the spotlight shifts lower to 1.2500. Note that the Stochastics, although below their 20 oversold level, seem to have found a turning point.
Failure to bounce back above the 1.2600 – 1.2625 region, which encapsulates the broken trendline, the 200-day simple moving average (SMA) and the 50% Fibonacci retracement of the 1.2287 – 1.2962 upleg could press the price towards the 61.8% Fibonacci of 1.2500. Lower, the 1.2430 – 1.2450 tight zone could be the last opportunity for a rebound before the way clears towards the 1.2287 trough.
In the event of an upside reversal above 1.2625, the 20- and 50-day SMAs could immediately pause the bull run alongside the 38.2% Fibonacci of 1.2700. If not, the recovery may continue towards the 23.6% Fibonacci of 1.2830, while not far above, traders may pay attention to the tentative resistance trendline at 1.2880 before targeting the top of 1.2962.
All in all, USDCAD has stepped below a long-term supportive trendline, exposing itself to additional declines. Yet the bearish breakout is still at an early stage and only if the 1.2600 – 1.2625 area proves a firm resistance could the sell-off get new legs.
면책 조항: 본 게시글에 표현된 견해는 전적으로 작성자의 견해이며 Followme의 공식 입장을 대변하지 않습니다. Followme는 제공된 정보의 정확성, 완전성 또는 신뢰성에 대해 책임을 지지 않으며, 서면으로 명시적으로 언급되지 않는 한 해당 내용을 기반으로 취해진 어떠한 조치에 대해서도 책임을 지지 않습니다.

더 오래된 의견은 없습니다. 소파를 가장 먼저 잡으십시오.