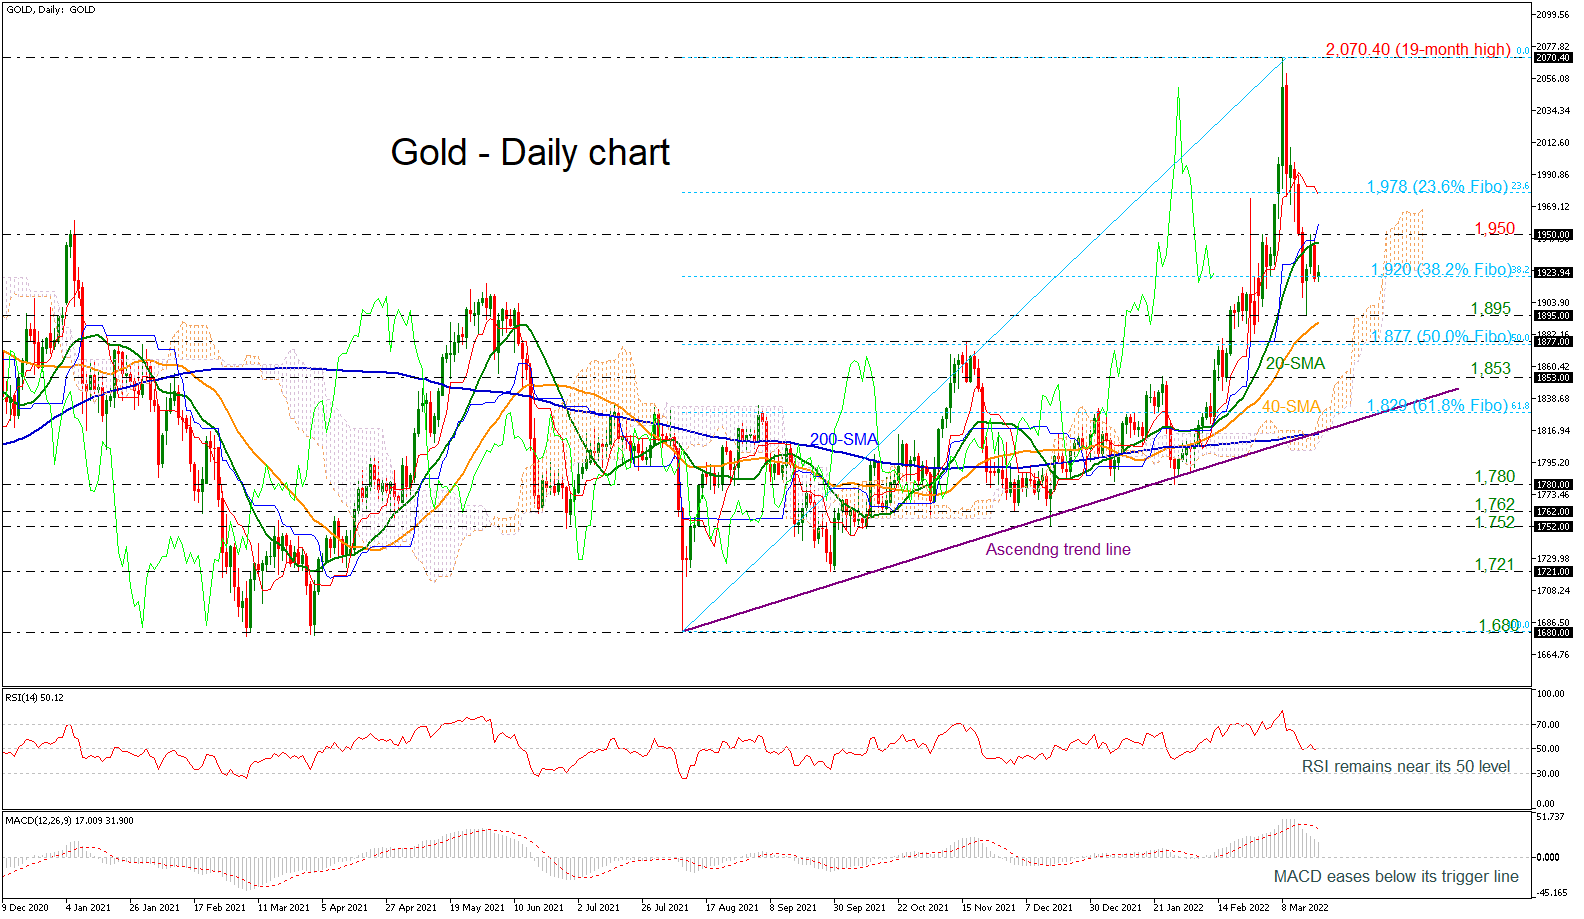
Gold prices are continuing last week’s move around the key level of 1,920, which is the 38.2% Fibonacci retracement level of the up leg from 1.680 to 2,070.40 and at the same time is confirming the pullback from the 1,950 resistance and the 20-day simple moving average (SMA).
The short-term bias looks negative as the MACD keeps losing ground below its red signal line, while the RSI seems to be making its way near its 50-neutral mark, though a further decline is needed from both indicators to confirm the negative momentum.
The 1,895 support and the 40-day SMA currently at 1,890 could be a trigger point for steeper bearish action if the pair manages to break the 38.2% Fibonacci. Lower, support could come towards from the 50.0% Fibonacci at 1,877, a strong barrier last year, though more sellers could take the price until the 1,853 key level, which stands slightly above the uptrend line.
However, if the pair reverses back to the upside, investors could watch first the 1,950 resistance and then the 23.6% Fibonacci of 1,978, which overlaps with the red Tenkan-sen line of the Ichimoku indicator. If the price continues to rise, resistance could next come somewhere near the 19-month high of 2,070.40.
In the short-term picture, the pullback off the multi-month high turned the strongly bullish outlook to negative.
However, in the bigger picture, chances for another bullish move are still rising as the yellow metal is still holding above the ascending trend line and the 200-day SMA.
면책 조항: 본 게시글에 표현된 견해는 전적으로 작성자의 견해이며 Followme의 공식 입장을 대변하지 않습니다. Followme는 제공된 정보의 정확성, 완전성 또는 신뢰성에 대해 책임을 지지 않으며, 서면으로 명시적으로 언급되지 않는 한 해당 내용을 기반으로 취해진 어떠한 조치에 대해서도 책임을 지지 않습니다.

더 오래된 의견은 없습니다. 소파를 가장 먼저 잡으십시오.