


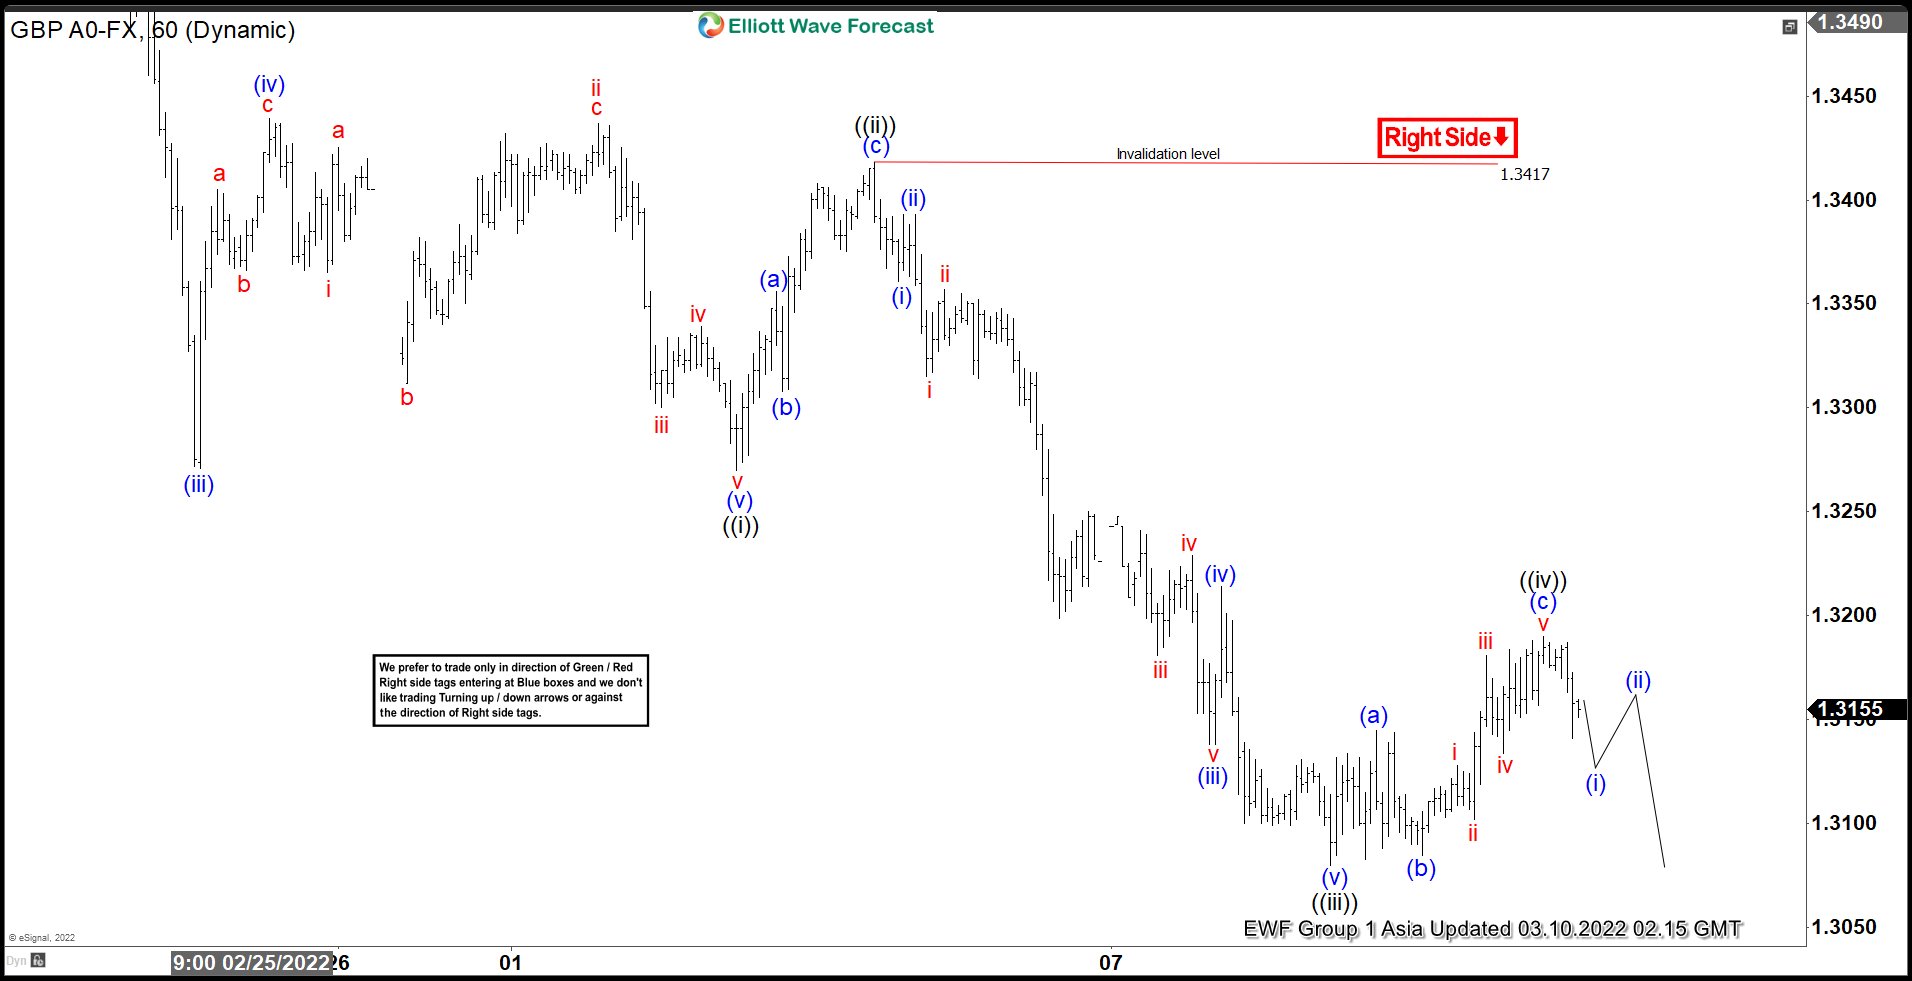
Short Term Elliott Wave View in GBPUSD suggests that the decline from February 18 peak is unfolding as a 5 waves impulse Elliott Wave structure. Down from February 18, wave (i) ended at 1.3536, and rally in wave (ii) ended at 1.3621. Pair then resumes lower in wave (iii) towards 1.3272, and rally in wave (iv) ended at 1.3439. Final leg lower wave (v) ended at 1.327 which also completed wave ((i)). Rally in wave ((ii)) completed at 1.3417 with internal subdivision as a zigzag. Up from wave ((i)), wave (a) ended at 1.335, pullback in wave (b) ended at 1.3308, and wave (c) higher ended at 1.3417 which completed wave ((ii)).
Pair resumes lower in wave ((iii)) with internal subdivision as an impulse. Down from wave ((ii)), wave (i) ended at 1.336, and wave (ii) ended at 1.3393. Pair resumes lower in wave (iii) which ended at 1.3138, and wave (iv) rally ended at 1.3214. Final leg lower wave (v) of ((iii)) ended at 1.3080. Wave ((iv)) rally in GBPUSD ended at 1.3190 with internal subdivision as a flat Elliott Wave structure. Near term, expect pair to extend lower in wave ((v)). As far as pivot at 1.3417 high stays intact, rally should fail in the sequence of 3, 7, or 11 swing for further downside.
GBPUSD 60 Minutes Elliott Wave Chart
면책 조항: 본 게시글에 표현된 견해는 전적으로 작성자의 견해이며 Followme의 공식 입장을 대변하지 않습니다. Followme는 제공된 정보의 정확성, 완전성 또는 신뢰성에 대해 책임을 지지 않으며, 서면으로 명시적으로 언급되지 않는 한 해당 내용을 기반으로 취해진 어떠한 조치에 대해서도 책임을 지지 않습니다.

