


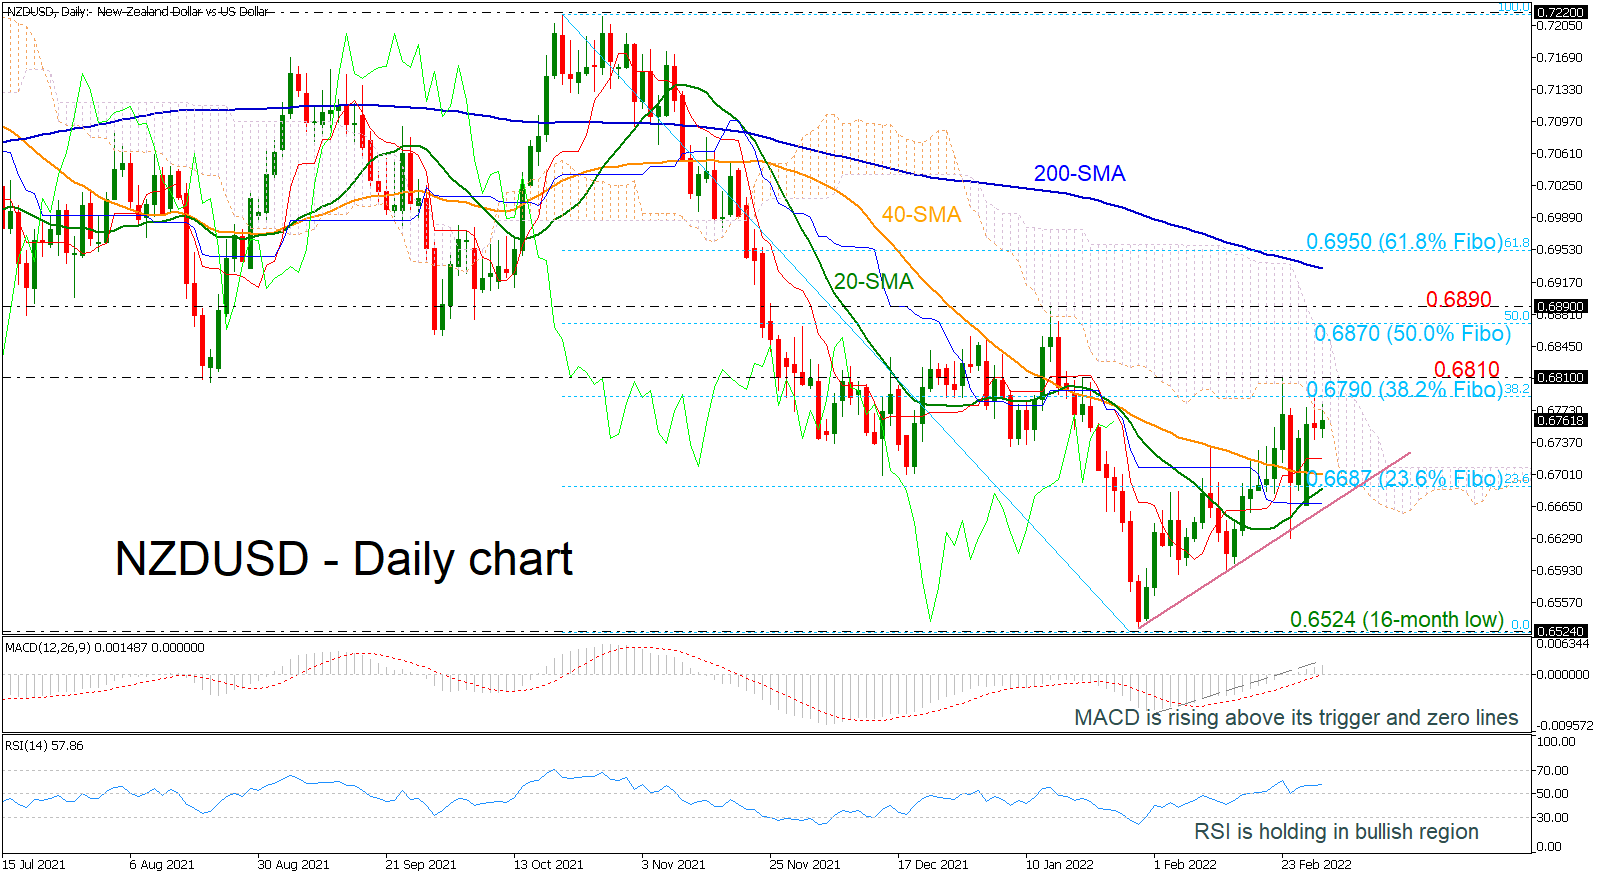
NZDUSD is creating higher highs and higher lows in the short-term, following the rebound off the 16-month low of 0.6524. Currently, the price is failing to surpass the 38.2% Fibonacci retracement level of the down leg from 0.7220 to 0.6524 at 0.6790, with the technical indicators suggesting more bullish actions.
The MACD is strengthening its positive bias above its trigger and zero lines, while the RSI is flattening in the bullish region. In trend indicators, the 20- and 40-day simple moving averages (SMAs) are ready for a positive crossover, signaling greater upside tendency.
If the price climbs beyond the 0.6790 and 0.6810 resistance levels, the next barrier could come from the 50.0% Fibonacci at 0.6870 ahead of the 0.6980 level, taken from the previous highs. Steeper increases could add the optimism for a retest of the 200-day SMA at 0.6930.
On the other hand, a fall below the short-term SMAs and the near-term ascending trend line as well as a daily close beneath the 23.6% Fibonacci of 0.6687 could shift the bias back to bearish testing the 16-month trough of 0.6524 again.
To sum up, NZDUSD has been in a positive bias in the short-term view, while in the long-term, the pair is likely to remain negative until there is a push above the 200-day SMA at 0.6930.
면책 조항: 본 게시글에 표현된 견해는 전적으로 작성자의 견해이며 Followme의 공식 입장을 대변하지 않습니다. Followme는 제공된 정보의 정확성, 완전성 또는 신뢰성에 대해 책임을 지지 않으며, 서면으로 명시적으로 언급되지 않는 한 해당 내용을 기반으로 취해진 어떠한 조치에 대해서도 책임을 지지 않습니다.

