


Key Highlights
- EUR/USD failed near 1.1495 and started a downside correction.
- It traded below a key bullish trend line with support near 1.1385 on the 4-hours chart.
- GBP/USD is still struggling to clear the key 1.3600 resistance.
- Gold price extended rally above the $1,850 resistance.
EUR/USD Technical Analysis
The Euro made another attempt to clear the 1.1500 zone against the US Dollar. However, EUR/USD failed to gain pace and formed a short-term high near 1.1494.
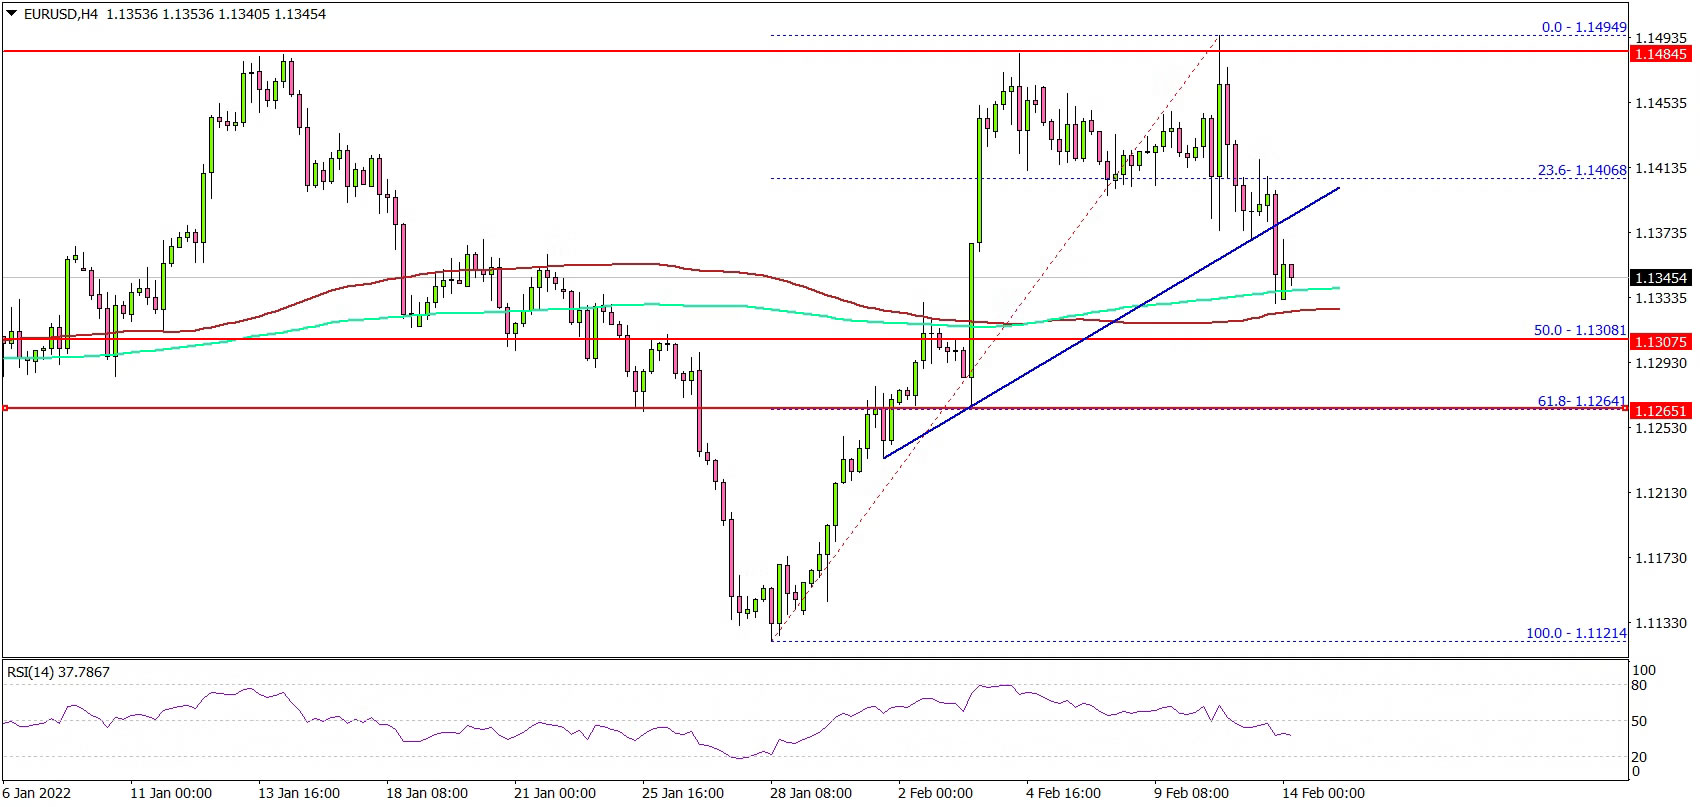
Looking at the 4-hours chart, the pair started a downside correction below the 1.1450 level. The pair spiked below the 38.2% Fib retracement level of the upward move from the 1.1124 swing low to 1.1494 high.
Besides, there was a break below a key bullish trend line with support near 1.1385 on the same chart. It tested the 100 simple moving average (red, 4-hours) and the 200 simple moving average (green, 4-hours).
The next major support is near the 1.1310 level. It is near the 50% Fib retracement level of the upward move from the 1.1124 swing low to 1.1494 high.
Any more losses could push EUR/USD towards the 1.1250 support. On the upside, the pair might face sellers near the 1.1400 level. The main breakout resistance is still near the 1.1480 and 1.1500 levels.
Looking at GBP/USD, the pair is still struggling to clear the 1.3600 resistance level. Conversely, gold price and crude oil price saw a major increase above $1,850 and $92.00 respectively.
Economic Releases
Swiss PPI for Jan 2022 (YoY) – Forecast +5.6%, versus +5.1% previous.
면책 조항: 본 게시글에 표현된 견해는 전적으로 작성자의 견해이며 Followme의 공식 입장을 대변하지 않습니다. Followme는 제공된 정보의 정확성, 완전성 또는 신뢰성에 대해 책임을 지지 않으며, 서면으로 명시적으로 언급되지 않는 한 해당 내용을 기반으로 취해진 어떠한 조치에 대해서도 책임을 지지 않습니다.

