


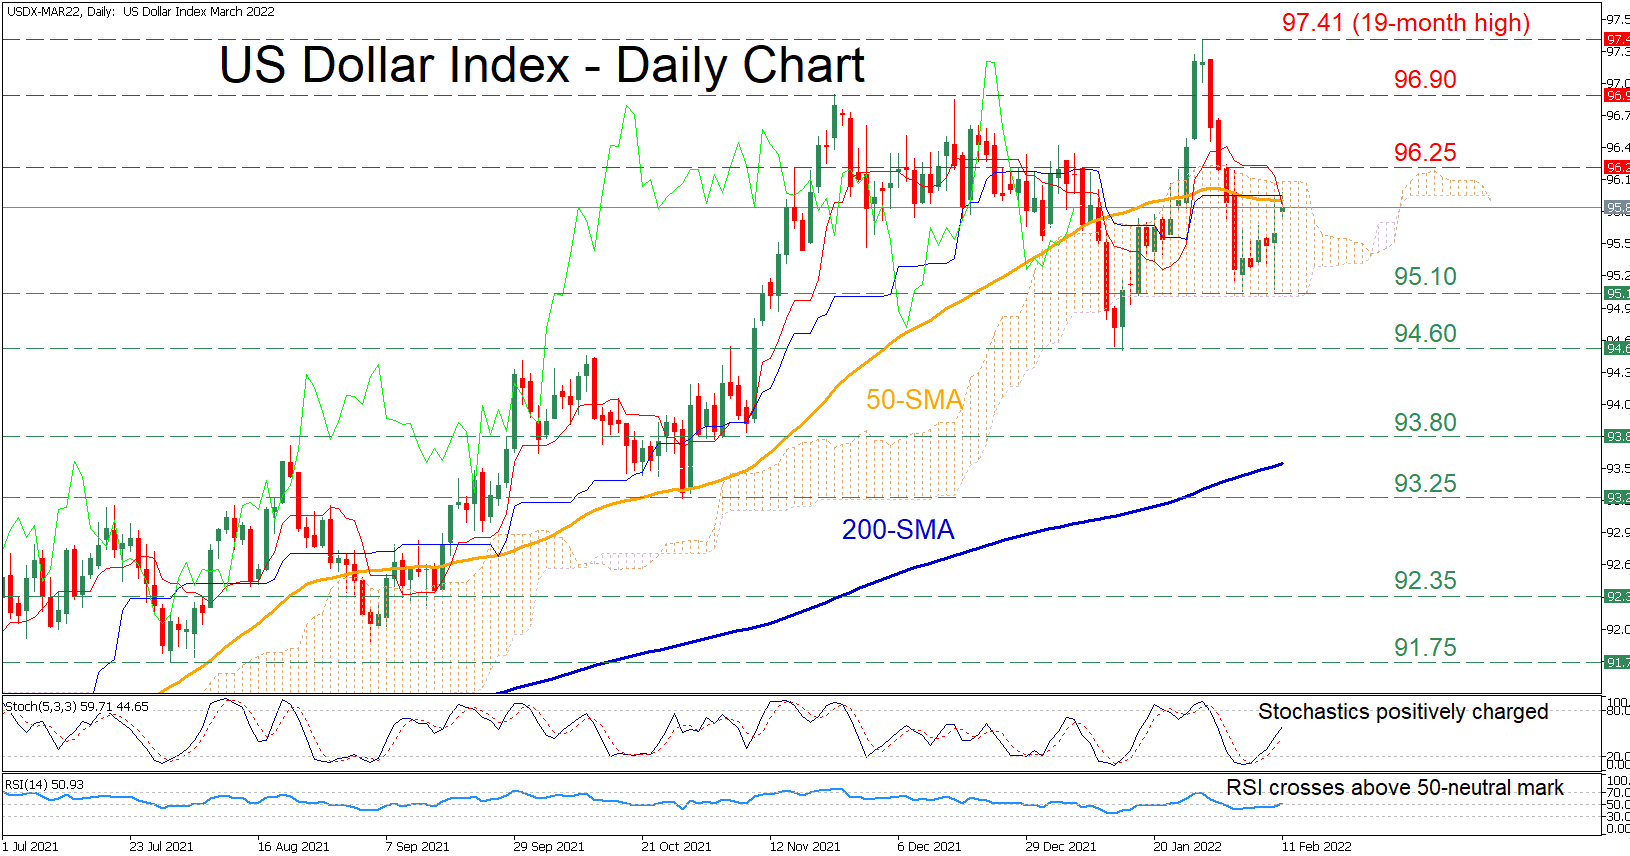
The US dollar index has experienced a minor pullback in the short-term after peaking at the 19-month high of 97.41. However, the price has regained traction since the 95.10 floor rejected a price decline twice, while the 50-day simple moving average (SMA) seems to be capping its upside move.
The momentum indicators reflect that bullish forces have gained the upper hand. The stochastic oscillator is trending upwards, and the RSI is pointing up after crossing above its 50-neutral mark.
Should the buying interest intensify further and the price crosses above its 50-SMA, initial resistance might be encountered at the 96.25 region. Conquering this hurdle, the bulls could then target the November high of 96.90. Crossing above this obstacle, the price ascent may cease at the 19-month high of 97.41 before the price marches higher to create fresh highs.
On the flipside, if positive momentum fades and the price reverses downwards the recent low of 95.10 could act as immediate support. Further downside pressure could send the price to test 94.60 or lower to challenge the 93.80 region. Dipping beneath these levels, the spotlight might turn to the 93.25 barrier.
Overall, the resumption of the US dollar index’s near-term rebound remains the most likely scenario. However, a break below the 95.10 barricade could trigger further selling interest, extending the index’s short-term decline.
면책 조항: 본 게시글에 표현된 견해는 전적으로 작성자의 견해이며 Followme의 공식 입장을 대변하지 않습니다. Followme는 제공된 정보의 정확성, 완전성 또는 신뢰성에 대해 책임을 지지 않으며, 서면으로 명시적으로 언급되지 않는 한 해당 내용을 기반으로 취해진 어떠한 조치에 대해서도 책임을 지지 않습니다.

