


Hi traders, today we’re watching a technical set-up that’s currently developing on the AUDCAD daily chart.
The pattern formation we’re watching today is called a V reversal. If confirmed, these can be potent setups and can lead to strong buyer momentum.
Looking at the D1 chart below, we have highlighted the previous V reversal pattern that was confirmed and led to a decent medium-term rally. The pattern emerges once price forms a decline and a fast counter-rally, creating the V shape pattern. Often you may also see a neckline, and it’s best to wait for the break from that point to confirm the pattern.
We can see in the current example that price has formed a neckline at .9050. We are waiting to see if the new HL will maintain buyer momentum and will break from that point to confirm the V pattern. This would also start a new medium-term uptrend. Looking forward, if we do see a rally develop, we could see resistance come in from .9120 and at 0.9275.
If price breaks below the current HL, we would start to worry about buyer momentum and if we see a new move back down to .8922 that would cancel the current V pattern.
AUDCAD D1 Chart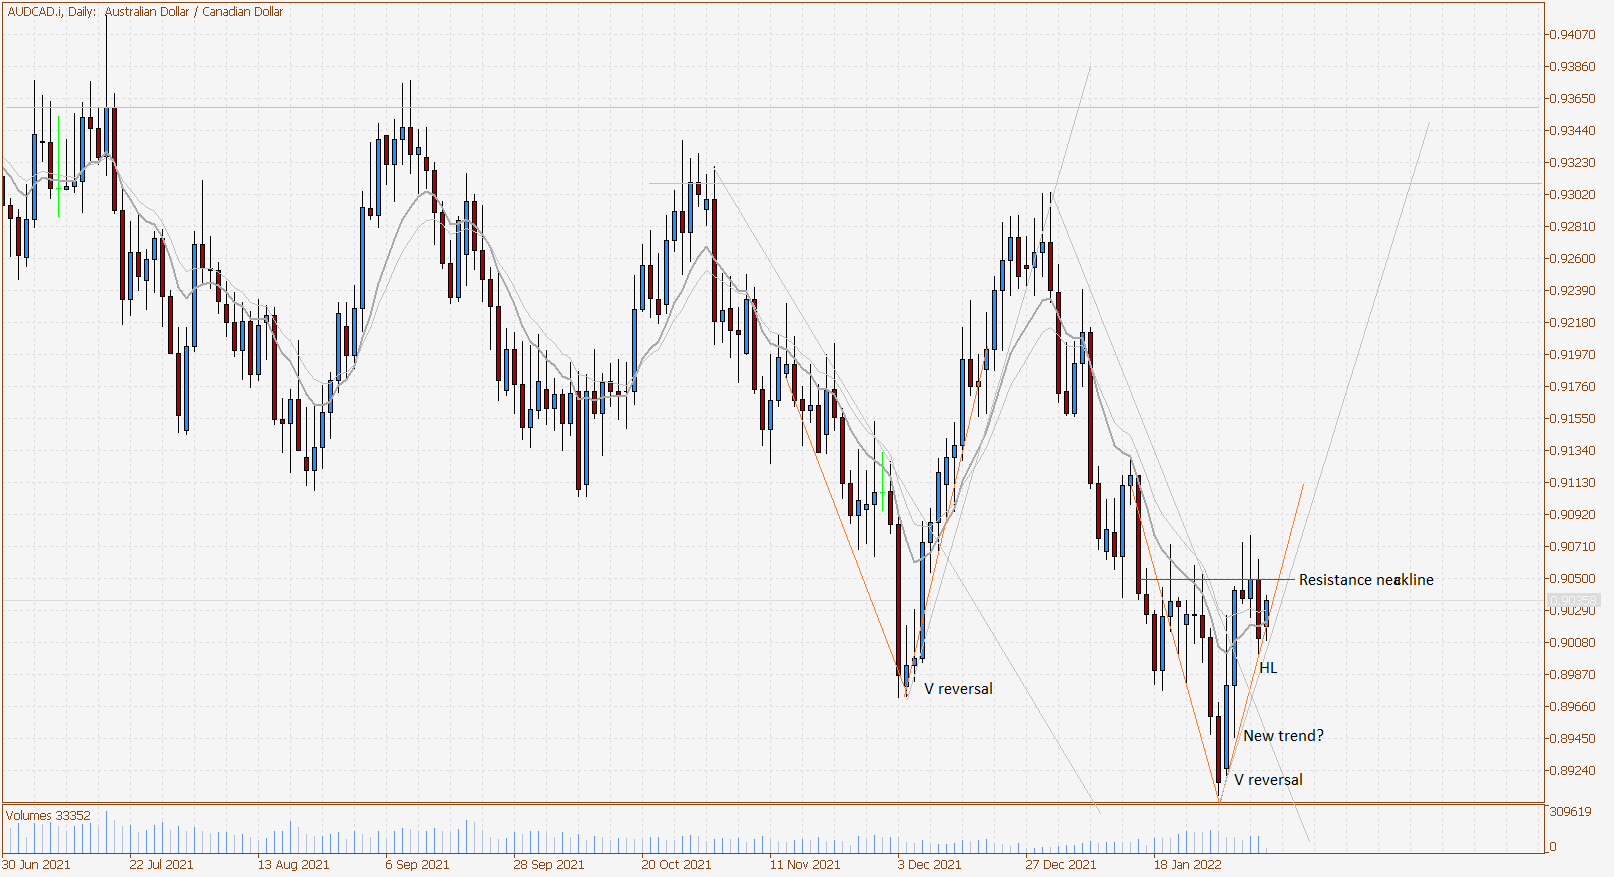
면책 조항: 본 게시글에 표현된 견해는 전적으로 작성자의 견해이며 Followme의 공식 입장을 대변하지 않습니다. Followme는 제공된 정보의 정확성, 완전성 또는 신뢰성에 대해 책임을 지지 않으며, 서면으로 명시적으로 언급되지 않는 한 해당 내용을 기반으로 취해진 어떠한 조치에 대해서도 책임을 지지 않습니다.

