


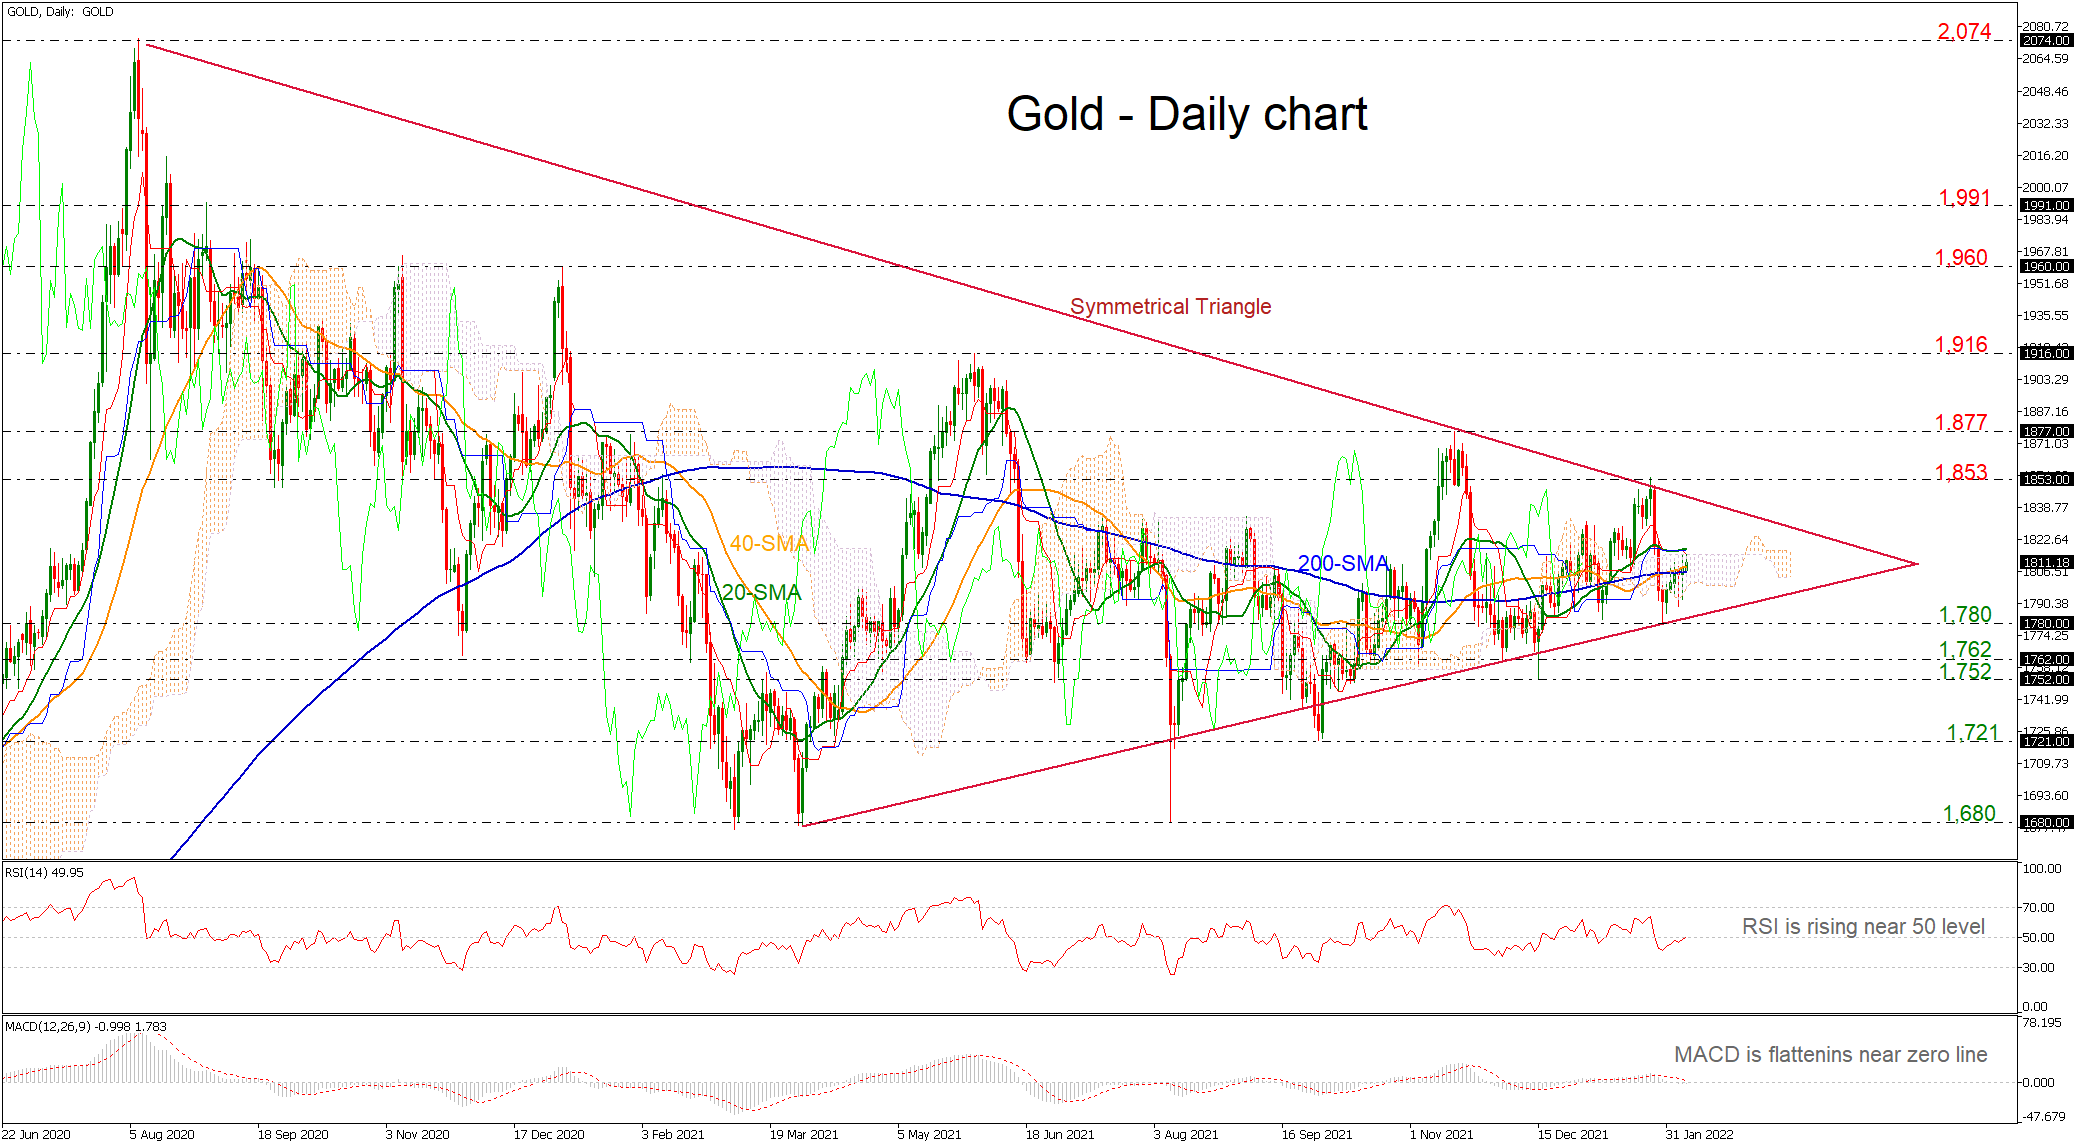
Gold prices have found a turning point at the 1,780 support level, which overlaps with the ascending trend line of the long-term symmetrical triangle. The price is currently testing the 40- and 200-day simple moving averages (SMAs), holding within the Ichimoku cloud in the short-term.
Technically, the RSI indicator is showing some positive signals as it is approaching the neutral threshold of 50 with stronger momentum than before. The MACD oscillator is edging sideways near its trigger and zero lines, failing to endorse any positive scenarios.
Should the price close comfortably above the 20-day SMA, which has been unbreakable over the past week, traders could add more momentum to the upside move, pushing the market up to 1,853. A move higher could reach the downtrend line at 1,836 ahead of the 1,853 resistance level. Penetrating these obstacles too, the market could switch the current outlook to positive, touching the recent 1,877 high and 1,960, registered in January 2021.
In the negative scenario the market could retest the bottom of 1,780. If this proves easy to overcome this time, the decline may next pause somewhere between 1,762-1,752, while even lower, investors could shift attention to the 1,721 number.
In brief, the yellow metal is in neutral mode in the short-term timeframe and any declines below the symmetrical triangle could endorse the bearish outlook. Otherwise, a climb above the downtrend line could add some fuel for positive move.
면책 조항: 본 게시글에 표현된 견해는 전적으로 작성자의 견해이며 Followme의 공식 입장을 대변하지 않습니다. Followme는 제공된 정보의 정확성, 완전성 또는 신뢰성에 대해 책임을 지지 않으며, 서면으로 명시적으로 언급되지 않는 한 해당 내용을 기반으로 취해진 어떠한 조치에 대해서도 책임을 지지 않습니다.

