


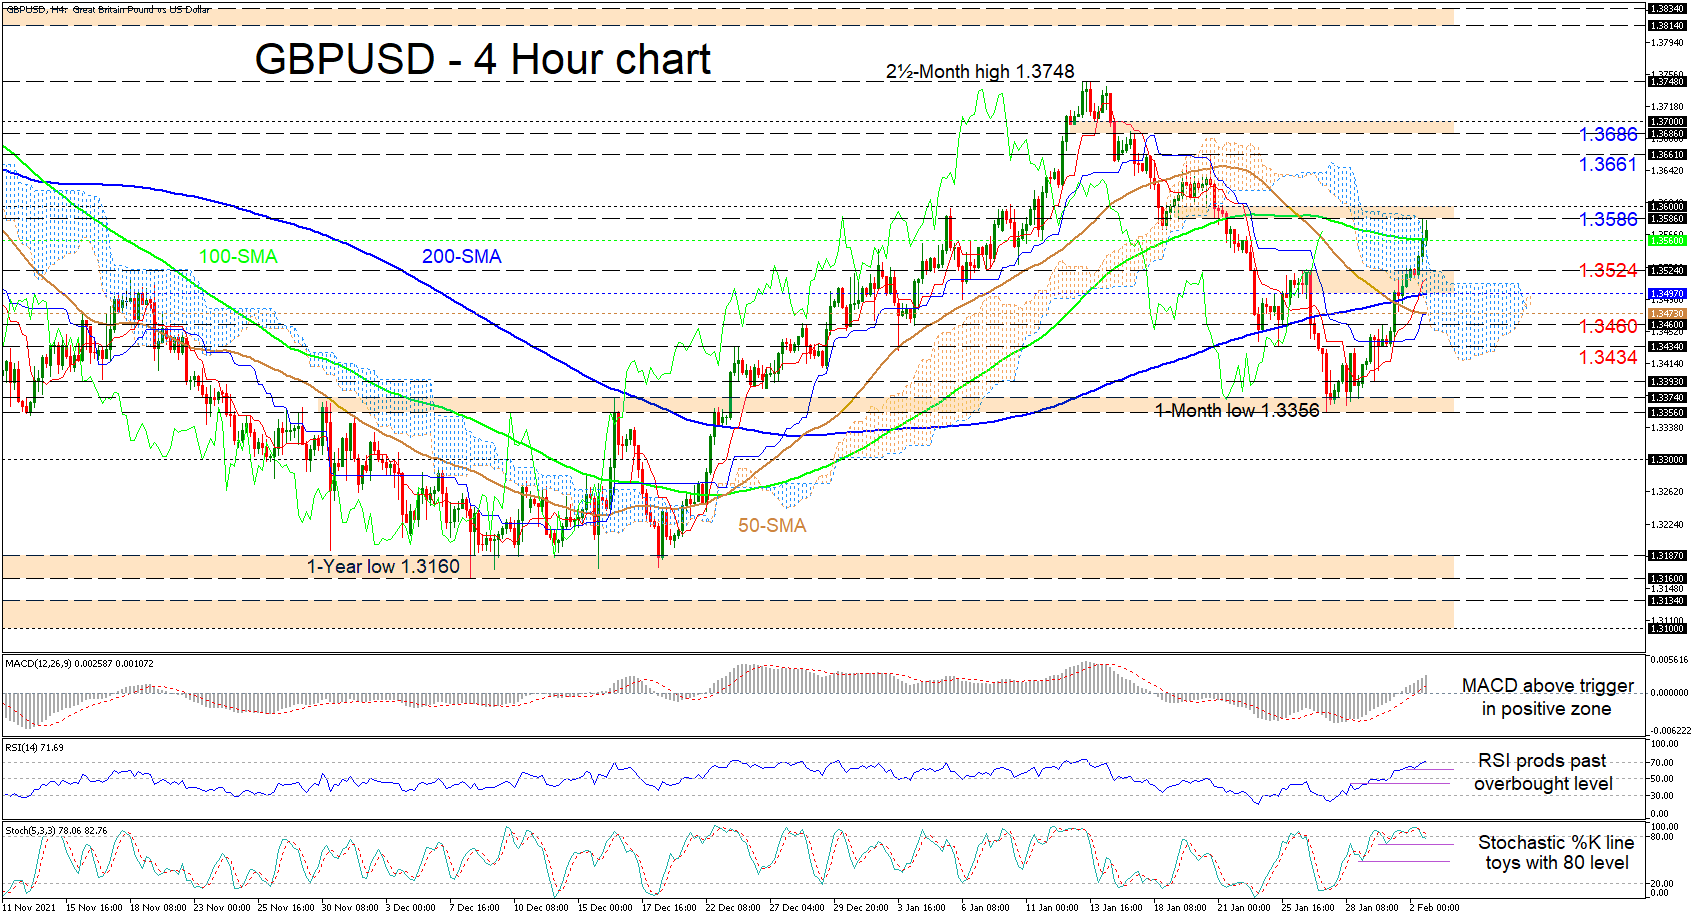
GBPUSD has nudged above the Ichimoku cloud and over the 100-period simple moving average (SMA) at 1.3560 and appears to be sustaining its optimistic tone from the bounce off the 1.3356 level. The SMAs are not reflecting a driving trend but the negative slopes of the 50- and 100-period SMAs have diminished to a degree.
The Ichimoku lines are indicating positive forces are growing, while the short-term oscillators are confirming upside momentum is persisting. The MACD is soaring above its red trigger line in the positive section, while the RSI is climbing in the overbought territory. The stochastic %K line is flirting with the 80 overbought level as positive pressures endure.
Maintaining the current price trajectory, resistance may originate from the 1.3586-1.3600 boundary. If additional gains unfold, the price could then propel towards the 1.3661 barrier before the bulls challenge the 1.3686-1.3700 resistance band.
If upside pressures subside around the 1.3586-1.3600 zone, progress in the pair could dwindle, with initial downside friction occurring at the 100-period SMA at 1.3560. Retreating below it, a key support section between the 1.3524 barrier and the 200-period SMA at 1.3497 could provide buyers with a footing. However, if this area fails to do so, the price could sink towards the space between the 50-period SMA at 1.3473 and the 1.3460 level, before sellers seek out the 1.3434 low.
Summarizing, GBPUSD is exhibiting a persistent bullish tone above the 200-period SMA and the 1.3524 inside swing high. A break above 1.3600 may boost the existing rally, while a dip the 200-period SMA around 1.3500 could feed negative tendencies.
면책 조항: 본 게시글에 표현된 견해는 전적으로 작성자의 견해이며 Followme의 공식 입장을 대변하지 않습니다. Followme는 제공된 정보의 정확성, 완전성 또는 신뢰성에 대해 책임을 지지 않으며, 서면으로 명시적으로 언급되지 않는 한 해당 내용을 기반으로 취해진 어떠한 조치에 대해서도 책임을 지지 않습니다.

