


Hello fellow traders. In this technical blog we’re going to take a quick look at the Elliott Wave charts of NZDUSD. As our members know, NZDUSD is showing incomplete bearish sequences in the cycle from the February 2021 peak. Recently the pair gave us 3 waves bounce against the 0.7217 peak. Recovery unfolded as Elliott Wave Zig Zag pattern ABC. Once the price reached equal legs A-B sellers appeared and we got the turn lower. In the further text we are going to explain the Elliott Wave Pattern and the Forecast.
Before we take a look at the real market example, let’s explain Elliott Wave Zigzag pattern.
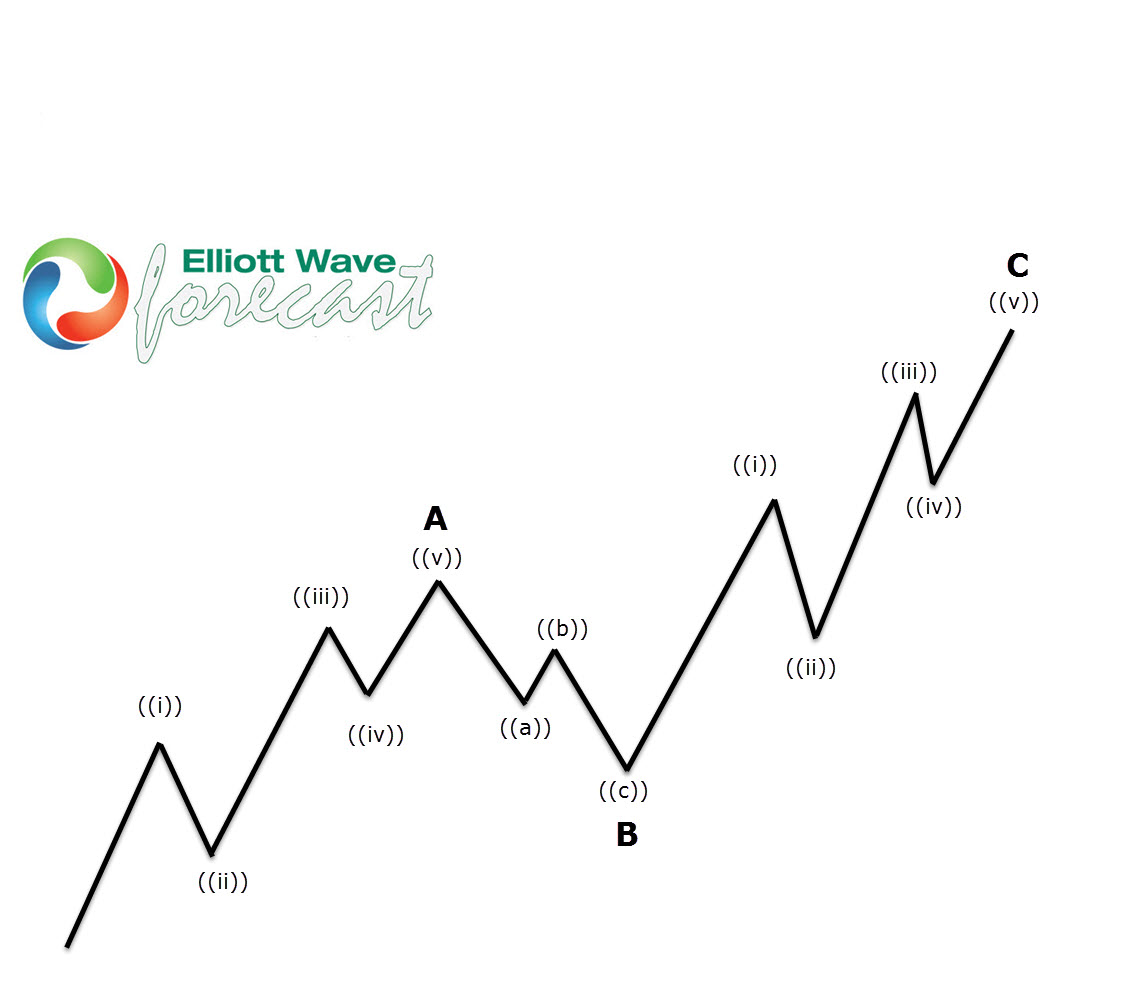
Elliott Wave Zigzag is the most popular corrective pattern in Elliott Wave theory . It’s made of 3 swings which have 5-3-5 inner structure. Inner swings are labeled as A,B,C where A =5 waves, B=3 waves and C=5 waves. That means A and C can be either impulsive waves or diagonals. (Leading Diagonal in case of wave A or Ending in case of wave C) . Waves A and C must meet all conditions of being 5 wave structure, such as: having RSI divergency between wave subdivisions, ideal Fibonacci extensions and ideal retracements.
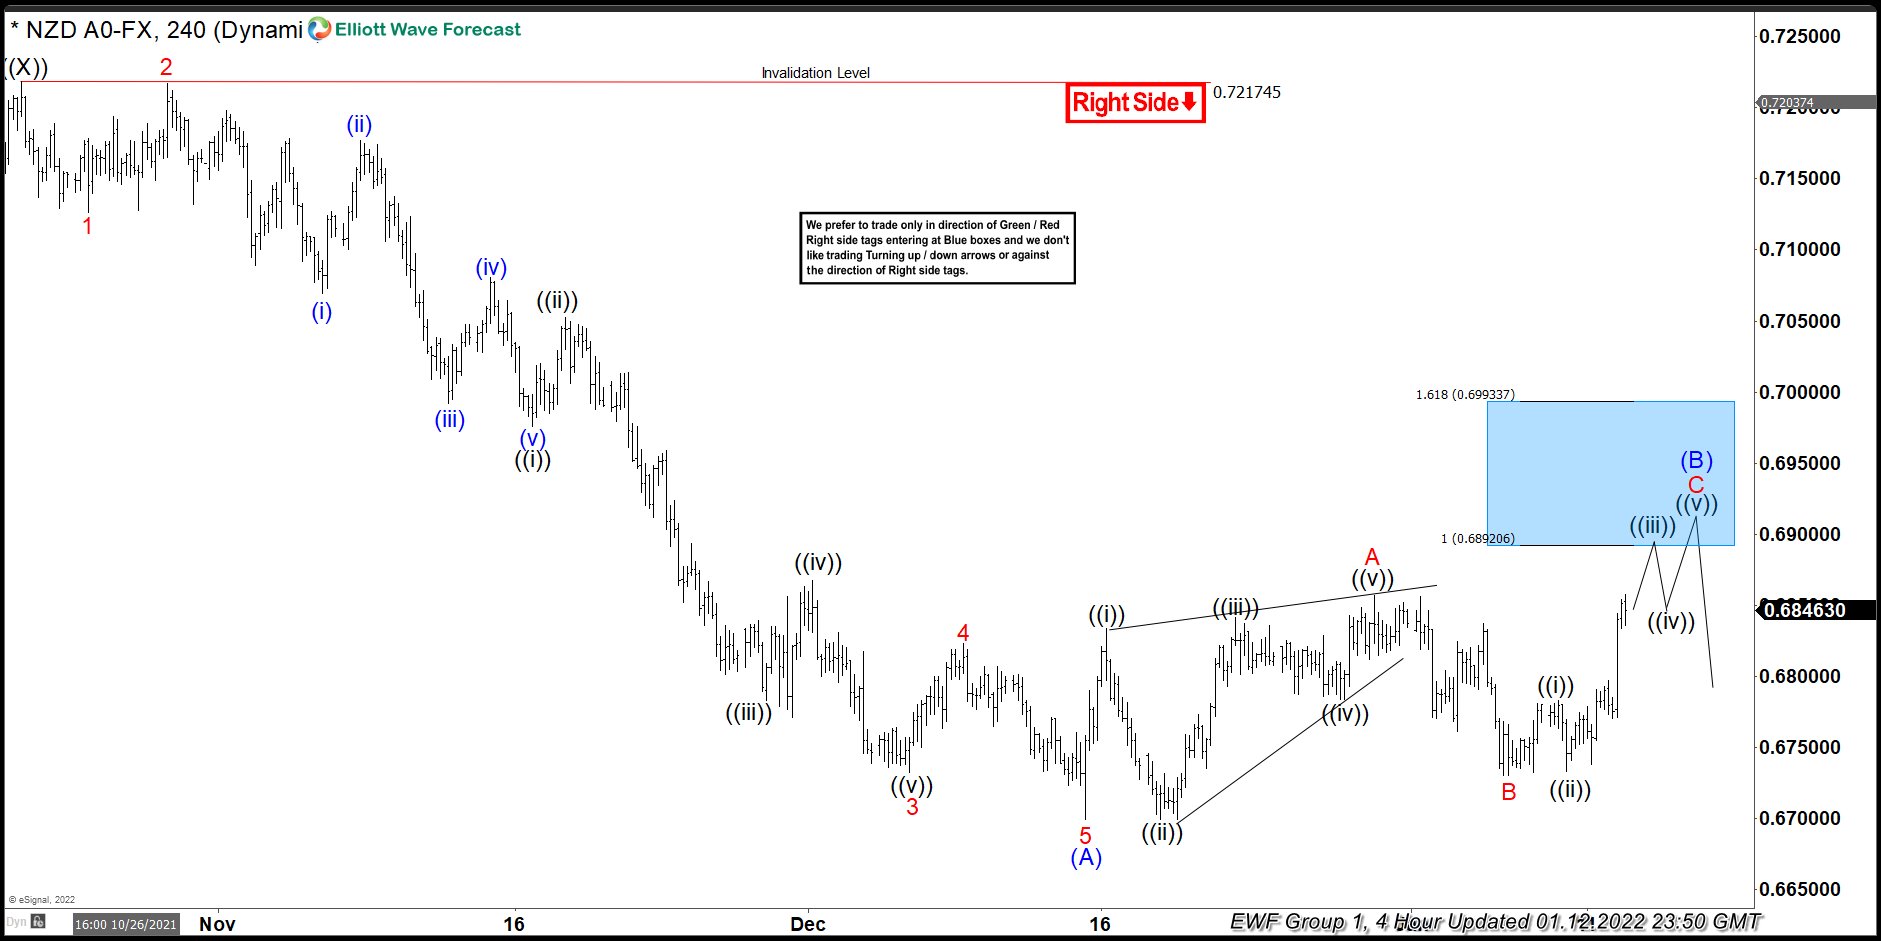
NZDUSD H4 Elliott Wave Analysis 01.12.2022
NZDUSD is correcting the cycle from the 0.72174 peak. Recovery looks incomplete at the moment. So far we got 5 waves up from the lows, which is uggesting we have ended only first leg of potential Elliott Wave Zig Zag Pattern . Consequently we are calling for another leg up toward 0.6892 + area to complete (B) blue recovery as Elliott Wave Zig Zag pattern. Proposed leg up which should be also made out of 5 waves.We don’t recommend buying the pair and favor the short side from higher levels once (B) recovery reaches its extremes. ( blue box)
As our members know Blue Boxes are no enemy areas , giving us 85% chance to get a pull back.
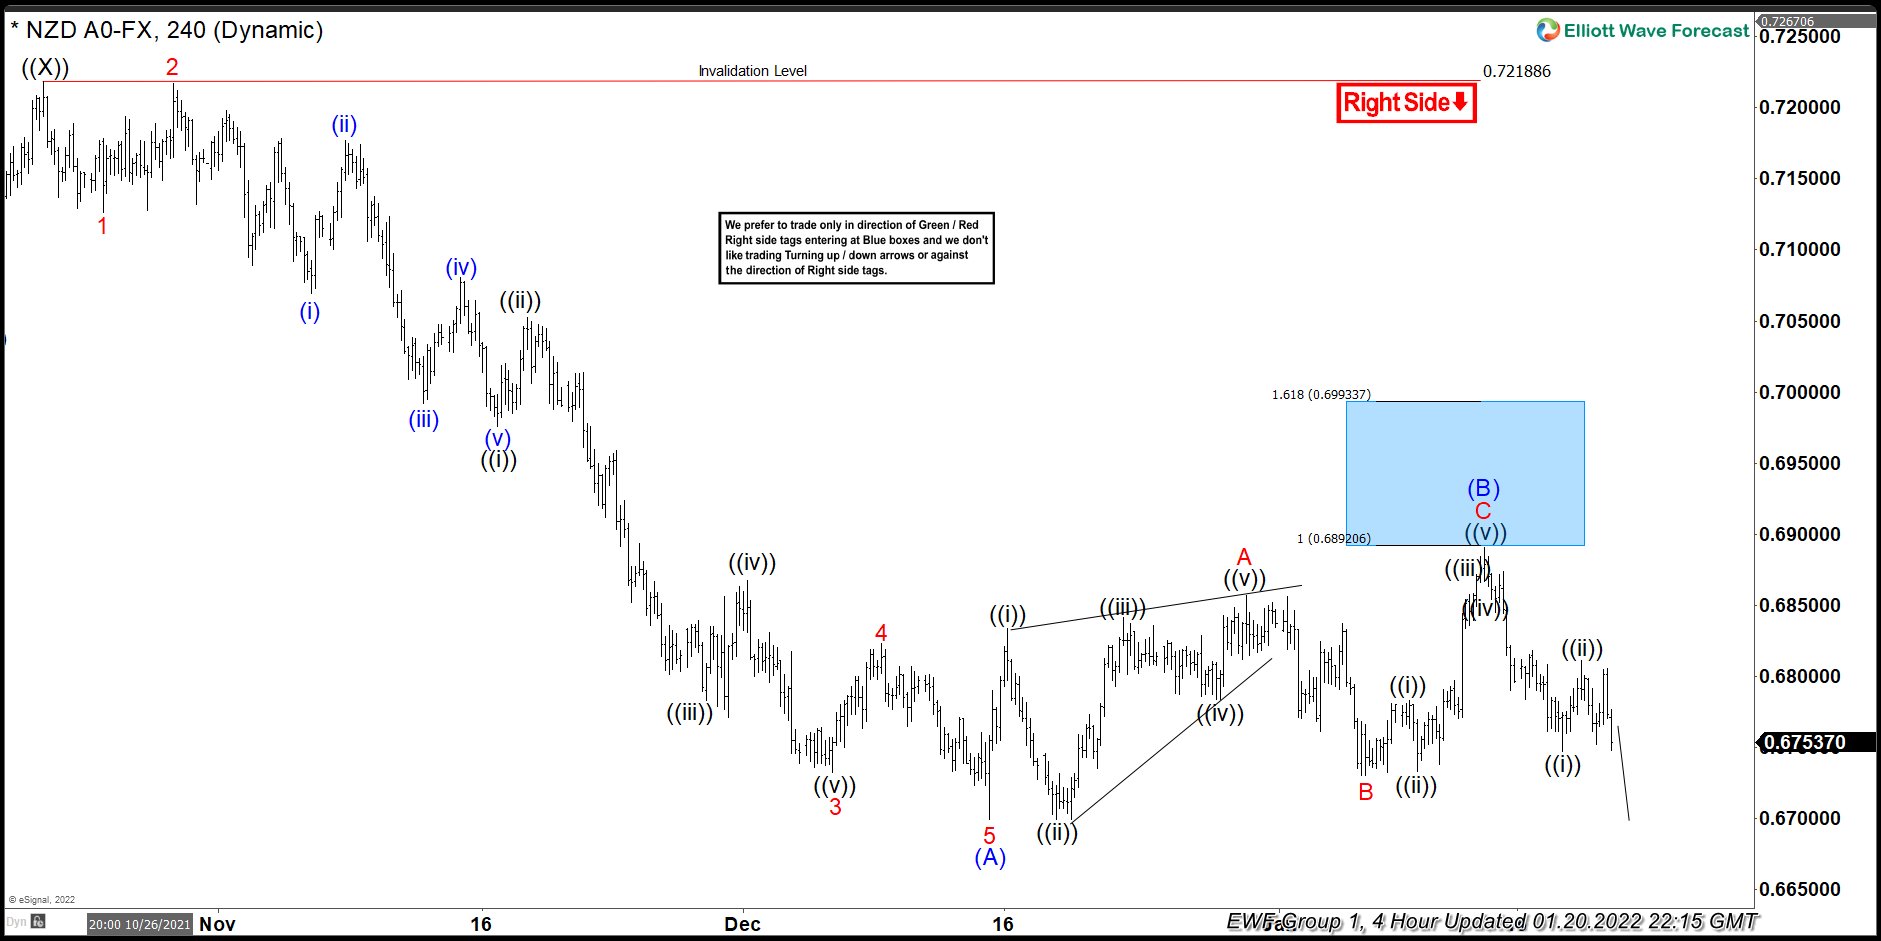
NZDUSD H4 Elliott Wave Analysis 01.12.2022
The price almost reached equal legs area at 0.6892 ( blue box) and made turn lower from there. Entry zone was missed by a few pips. At this stage we are calling recovery completed at 0.68912 high. Now we would like to see further extension down and break below (A) blue low – 12/15 low which would be confirmation wave (C) is in progress.
Keep in mind market is dynamic and presented view could have changed in the mean time. You can check most recent charts in the membership area of the site. Best instruments to trade are those having incomplete bullish or bearish swings sequences.We put them in Sequence Report and best among them are shown in the Live Trading Room.
면책 조항: 본 게시글에 표현된 견해는 전적으로 작성자의 견해이며 Followme의 공식 입장을 대변하지 않습니다. Followme는 제공된 정보의 정확성, 완전성 또는 신뢰성에 대해 책임을 지지 않으며, 서면으로 명시적으로 언급되지 않는 한 해당 내용을 기반으로 취해진 어떠한 조치에 대해서도 책임을 지지 않습니다.

