


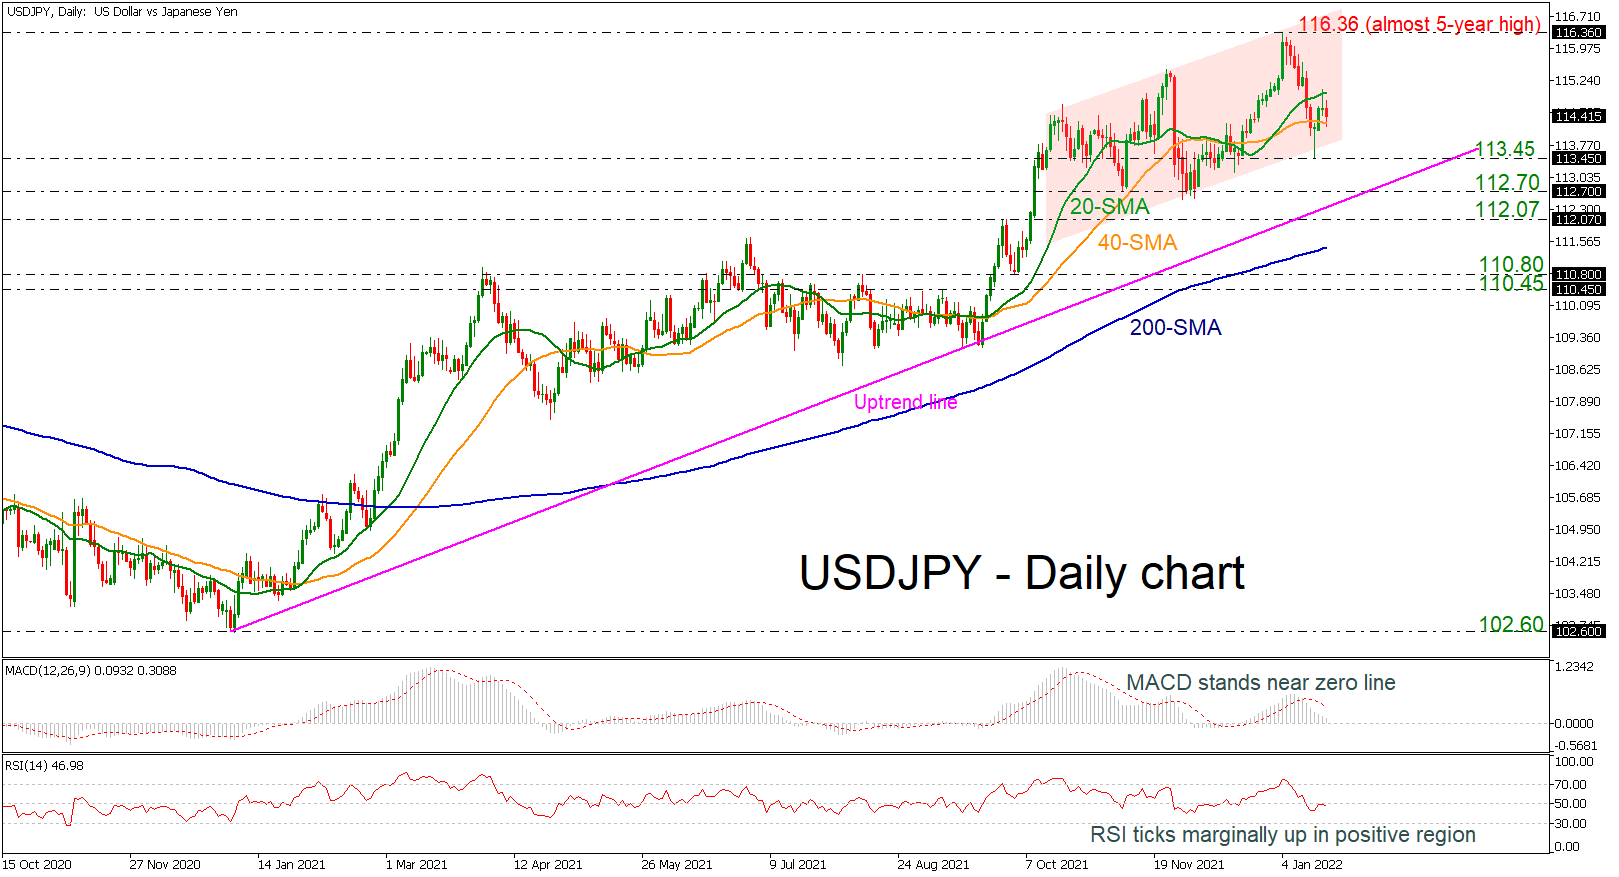
USDJPY is hovering within the 20- and 40-day simple moving averages (SMAs) after the bounce off the 113.45 support level that posted on Friday, creating an impressive spike. If the price jumps above the 20-day SMA, it could confirm a bullish doji pattern which is behaving as a reversal formation.
Regarding the technical indicators, the MACD is weakening in the positive area, below its trigger line, while the RSI is sloping marginally down in the negative region, both suggesting the next move to the downside rather to the upside.
If sellers drive the pair lower, immediate support could come from the recent low at 113.45 before touching the long-term ascending trend line around 112.70. A dive below this line could open the door for bearish moves, hitting 112.07 and the 200-day SMA at 111.45.
On the flip side, a climb beyond the 20-day SMA may boost the price until the almost five-year high of 116.36 before the bullish rally continues towards the January 2017 high of 118.60.
In brief, the long- and medium-term pictures are bullish, but if there is a decline below the uptrend line near 112.70, it may turn the outlook to neutral.
면책 조항: 본 게시글에 표현된 견해는 전적으로 작성자의 견해이며 Followme의 공식 입장을 대변하지 않습니다. Followme는 제공된 정보의 정확성, 완전성 또는 신뢰성에 대해 책임을 지지 않으며, 서면으로 명시적으로 언급되지 않는 한 해당 내용을 기반으로 취해진 어떠한 조치에 대해서도 책임을 지지 않습니다.

