


Our weekly analysis on Elliott Waves takes a close look at the GBP/USD, the Ethereum cryptocurrency, and the Gold commodity.
Our analysis indicates a bearish ABC correction on the GBP/USD, a potential 5 waves down on ETH/USD, and a slow wave 4 pattern on XAU/USD.
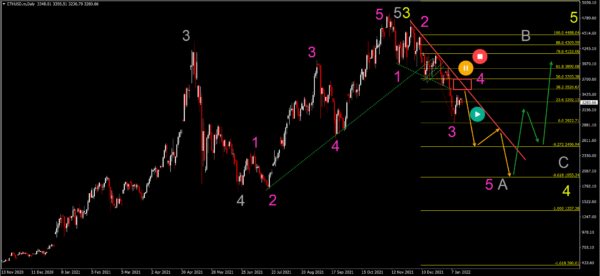
ETH/USD downtrend must respect shallow Fibs
The Ethereum (ETH/USD) cryptocurrency pair is in a downtrend after breaking below the support trend lines (dotted green):
- Price action could be moving down lower in 5 waves (pink). But price action should respect the shallow Fibonacci levels (red box) and resistance trend line (red).
- A break above these Fib levels place the bearish analysis on hold. A bearish bounce and continuation lower, however, could confirm the 5 wave pattern in wave A (grey).
- The main targets of the bearish swing are the -27.2% and -61.8% Fibonacci targets.
- In any case, a larger ABC (grey) pattern seems to be taking place in a wave 4 (yellow) correction.
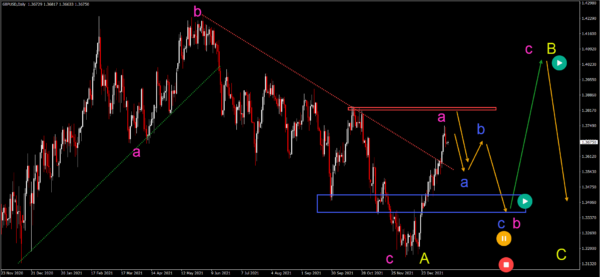
GBP/USD strength expected to face opposition
The GBP/USD is showing a strong bullish impulse, which was able to break above the resistance trend line (red) of the downtrend:
- The bulls however are facing a strong resistance zone from the previous top (red box). A bearish bounce is likely to occur here (orange arrows).
- A bearish ABC (blue) pattern could emerge at the resistance to create a pullback. But this could simply complete a wave B (pink) within a larger ABC (pink) pattern.
- The blue box could indicate an inverted head and shoulders pattern. A deeper bearish retracement would place the bullish ABC on hold or invalidate it. A stronger push up above the resistance (red box) however still will indicate a wave A (pink) most likely
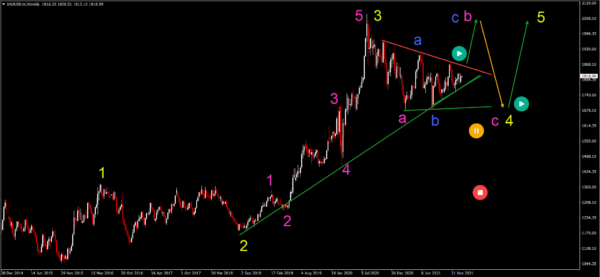
XAU/USD bullish chart pattern
Gold is moving sideways after a strong impulsive move up:
- A bullish break above (green arrow) the resistance (red) trend line could indicate an uptrend continuation. But if the current Elliott Wave analysis is correct, then the previous top should stop the uptrend.
- A bearish bounce (orange arrow) could complete the ABC (blue) in wave B (pink) and send price back down to the previous bottom.
- A bullish bounce (green arrow) at the previous bottom could complete the ABC (pink) pattern within wave 4 (yellow) and restart the uptrend.
- A deeper retracement below the previous bottom places the uptrend on hold or invalidates it.
면책 조항: 본 게시글에 표현된 견해는 전적으로 작성자의 견해이며 Followme의 공식 입장을 대변하지 않습니다. Followme는 제공된 정보의 정확성, 완전성 또는 신뢰성에 대해 책임을 지지 않으며, 서면으로 명시적으로 언급되지 않는 한 해당 내용을 기반으로 취해진 어떠한 조치에 대해서도 책임을 지지 않습니다.

