


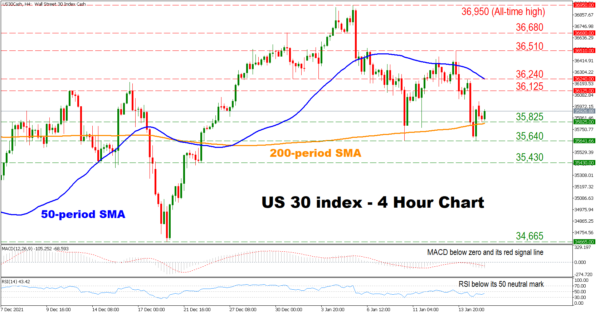
The US 30 index has retreated from its all-time high in early January amid strengthening negative momentum. Moreover, the index has crossed below the 50-period simple moving average (SMA), which is considered as a bearish sign for the near term.
Short-term momentum indicators are also reflecting a negative bias for the index, as the RSI is located below its 50 neutral mark. The MACD is found below zero and below its red signal line, indicating that negative momentum might be gaining further ground.
Should the bears remain in charge, initial support might be found at the region which includes the 35,825 level and the 200-period SMA currently at 35,800. A break below that area could pressure the price towards the 35,640 obstacle, before sellers eye the 35,430 hurdle. Crossing below the latter, could increase selling pressures, opening the door towards the 34,665 barrier.
On the flip side, if the bulls retake control, the first target might be the 36,125 resistance before shifting their attention towards the area which includes the 50-period SMA and the 36,240 level. A decisive move above the latter could restore positivity for the index, paving the way towards the 36,510 point. Surpassing this obstacle, the price could then test the 36,680 barrier before sellers shift their attention towards the all-time high at 36,950.
In brief, the short-term outlook for the index is cautiously bearish. For sentiment to change, buyers would need to drive the price above the 50-period SMA.
면책 조항: 본 게시글에 표현된 견해는 전적으로 작성자의 견해이며 Followme의 공식 입장을 대변하지 않습니다. Followme는 제공된 정보의 정확성, 완전성 또는 신뢰성에 대해 책임을 지지 않으며, 서면으로 명시적으로 언급되지 않는 한 해당 내용을 기반으로 취해진 어떠한 조치에 대해서도 책임을 지지 않습니다.

