


Ether (ETH) bounced off the support line of the descending channel on Jan. 10, suggesting that bulls are attempting to defend this level with vigor. The price could reach the overhead zone between the 20-day EMA ($3,536) and the resistance line of the channel.
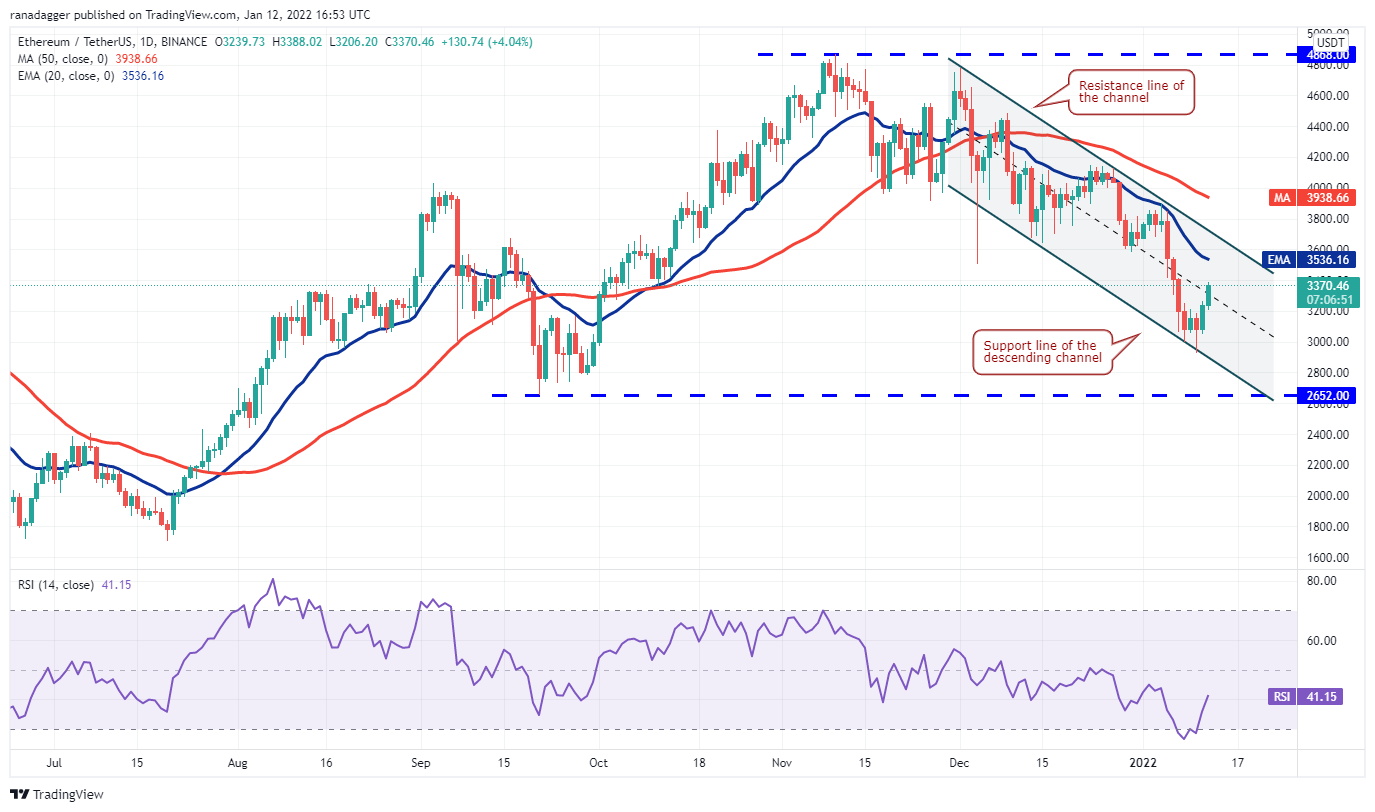
Both moving averages are trending down and the RSI is in the negative zone, indicating that bears have the upper hand. If the price turns down from the overhead zone, it will suggest that sentiment remains negative and traders are selling on rallies. The bears will then attempt to pull the ETH/USDT pair to the support line of the channel.
On the other hand, if bulls push the price above the overhead zone, the pair could rise to the 50-day SMA ($3,938). A break and close above this resistance will suggest a possible change in trend.
면책 조항: 본 게시글에 표현된 견해는 전적으로 작성자의 견해이며 Followme의 공식 입장을 대변하지 않습니다. Followme는 제공된 정보의 정확성, 완전성 또는 신뢰성에 대해 책임을 지지 않으며, 서면으로 명시적으로 언급되지 않는 한 해당 내용을 기반으로 취해진 어떠한 조치에 대해서도 책임을 지지 않습니다.

