


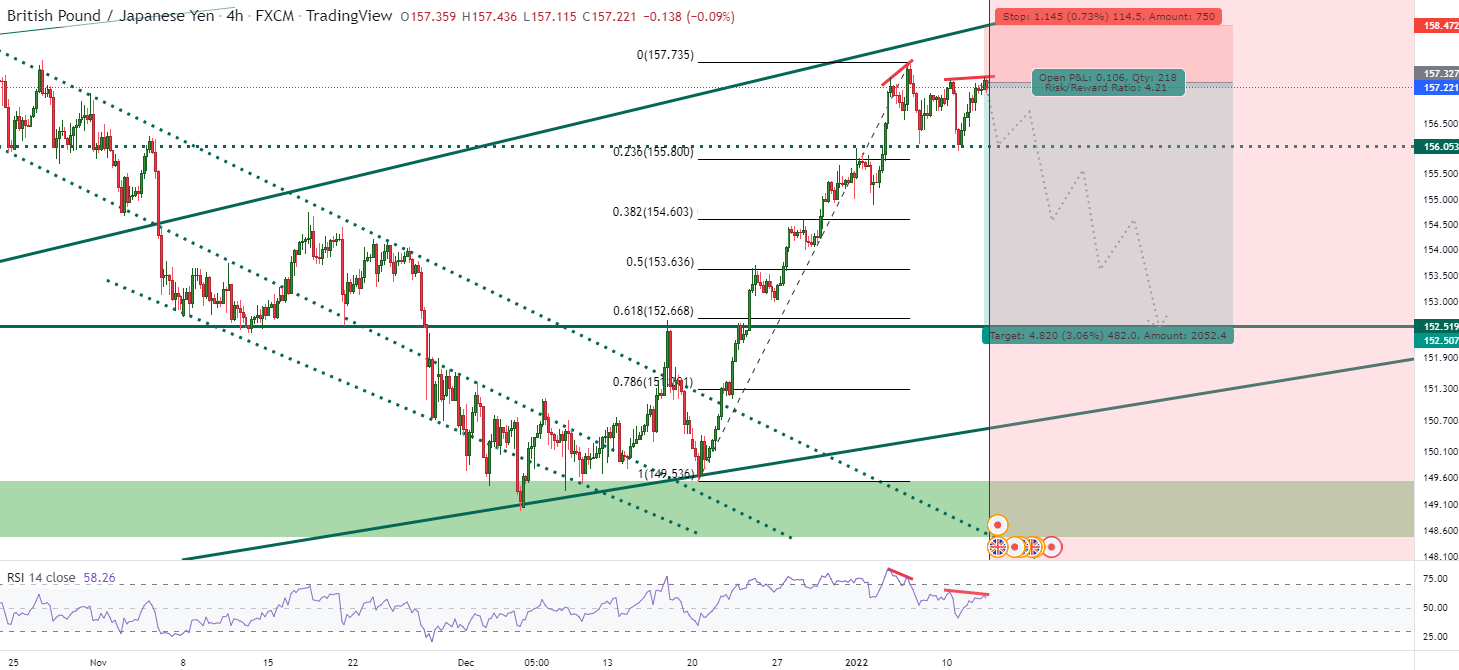
Technical: RSI Divergence in 4H chart generally brings pattern reversal in GJ. I have seen it many times before. Specially if two or more divergence happen for few times in the same price zone. There was a failed H&S also which means after forming the H&S the big players tried to take the direction in opposite way to fake it out and now they are accumulating their short position. It may test 157.76 area (the high created few days back) and also may test Oct high (158.20). So I am going to put my SL few pips above that (158.47)
Fundamental: Interest rate and other fundamental data was really good for GBP which drove the price to 149.53 to 157.63 in just 2 weeks time. Now as US is going to raise the interest rate and also will take hard measures to control inflation so it will added extra pressure on GBP and big investors generally take their position slowly much earlier than the actual decision come. So they are trying to fake out in the Long direction and then ultimately crush the price. It looks like JPY is really powerless at this moment so for this pair at this moment price movement is fully controlled by GBP.
This is not financial advice. Do your analysis before entering any position.
면책 조항: 본 게시글에 표현된 견해는 전적으로 작성자의 견해이며 Followme의 공식 입장을 대변하지 않습니다. Followme는 제공된 정보의 정확성, 완전성 또는 신뢰성에 대해 책임을 지지 않으며, 서면으로 명시적으로 언급되지 않는 한 해당 내용을 기반으로 취해진 어떠한 조치에 대해서도 책임을 지지 않습니다.

