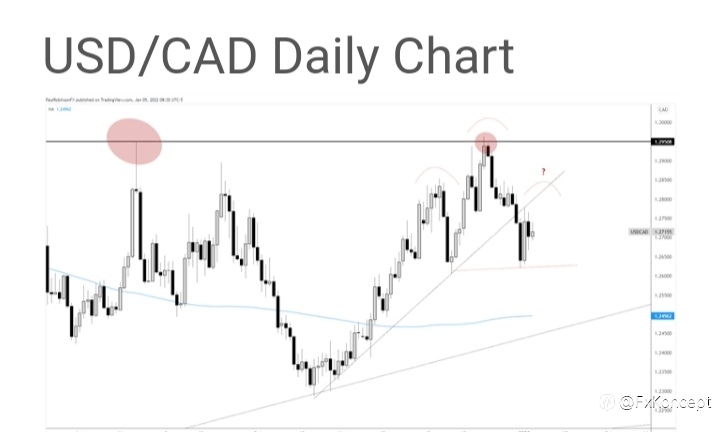
The last time I wrote about USD/CAD it was up against a major level, 12950 – it extends over from 2019 and had been validated as a meaningful level on numerous occasions. The mid-December test further validated its meaning.
But it doesn’t look like it will be tested again any time in the very near future as a bearish formation develops by way of a head-and-shoulders pattern. The pattern has yet to fully mature with a right shoulder, but could do-so soon.
The October trend-line was broken and seen as having already, or perhaps with one more push higher, capping strength. A turn lower and break of the neckline and 12606 is seen as validating the bearish head-and-shoulders pattern.
Given the height of the pattern the projected move could take USD/CAD back to the October low under 12300. But before getting to that point the June trend-line and gradually rising 200-day moving average (currently at 12496) would be considered a solid form of support to watch.
On the flip-side, should we see price stay above the neckline and recent lows down to 12606, then the outlook will remain neutral with only a very short-term negative bias. The key is for the H&S pattern to break for sellers to truly gain the upper hand.
면책 조항: 본 게시글에 표현된 견해는 전적으로 작성자의 견해이며 Followme의 공식 입장을 대변하지 않습니다. Followme는 제공된 정보의 정확성, 완전성 또는 신뢰성에 대해 책임을 지지 않으며, 서면으로 명시적으로 언급되지 않는 한 해당 내용을 기반으로 취해진 어떠한 조치에 대해서도 책임을 지지 않습니다.

더 오래된 의견은 없습니다. 소파를 가장 먼저 잡으십시오.