


· Views 289
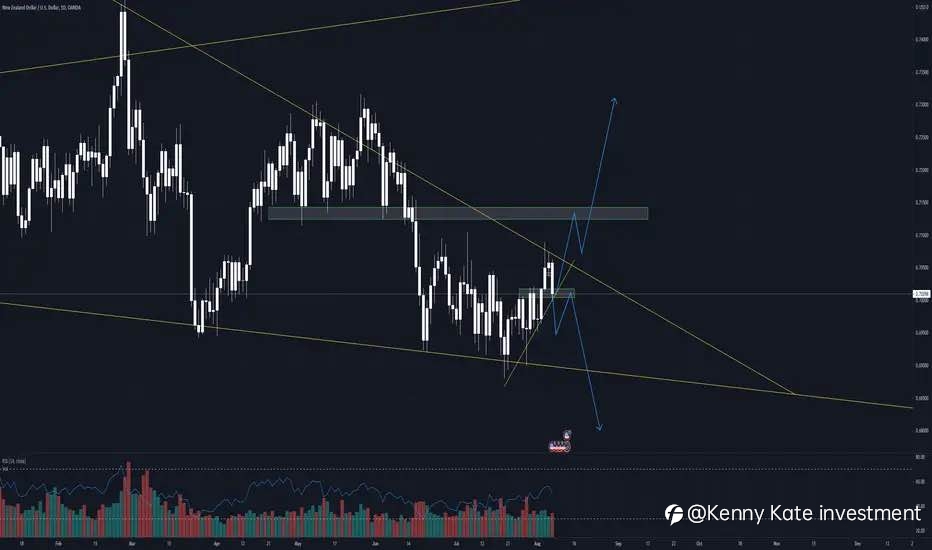
On this daily chart of NZDUSD , I am seeing a wedge pattern for this pair. So far, it is creating higher lows in the lower time frames (30 minutes,1 and 4 hour). As long as it holds this area around 0.7010 where my green rectangle is, I would be leaning more towards it breaking out. However, if it breaks below that, then there's a likelihood of NZDUSD coming down to re-test the lows around 0.6900.
We'll see next week and good luck trading!
We'll see next week and good luck trading!
면책 조항: 본 게시글에 표현된 견해는 전적으로 작성자의 견해이며 Followme의 공식 입장을 대변하지 않습니다. Followme는 제공된 정보의 정확성, 완전성 또는 신뢰성에 대해 책임을 지지 않으며, 서면으로 명시적으로 언급되지 않는 한 해당 내용을 기반으로 취해진 어떠한 조치에 대해서도 책임을 지지 않습니다.
이 글이 마음에 드시나요? 작성자에게 팁을 보내 감사의 마음을 전하세요.

