


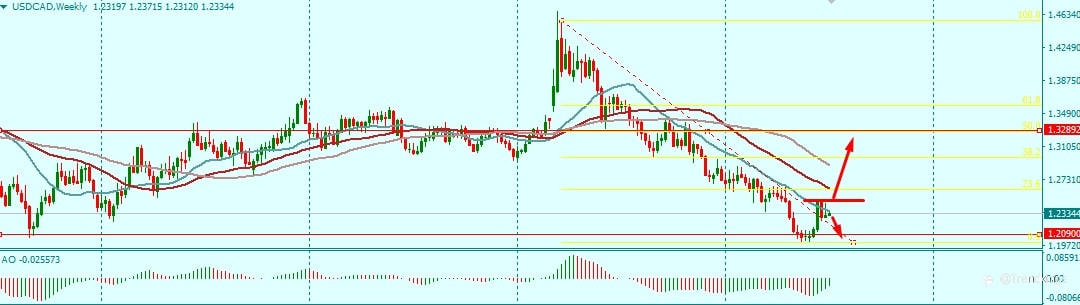
For the past 1 year, USDCAD Weekly has been on a classic downtrend. On March 2020, Price found a major resistance at 1.4642, and from the weekly candle view, price has repeated a perfect LL and LH pattern and has formed below the EMAs till date. Price hits 1.2090 monthly support level, forming a LL where price retraced to 1.2490 which is another key resistance level. Price at 1.2490 respects not only the 20 EMA, but it’s also in symmetry with a previous LH.
In my opinion there are various possible outcomes for the USDCAD; price may fall to form a double bottom; Price may breakout to the upside as the current weekly LL was formed at a strong Monthly Support level, there has also been a breakout of a weekly trend line. Who knows if the current climatic condition in Canada may also weaken its currency?
Disclaimer: What I have shared above is not a financial or investment advice of any sort, it’s just for educational purposes only, whatever trading decision you make is at your own risk.
면책 조항: 본 게시글에 표현된 견해는 전적으로 작성자의 견해이며 Followme의 공식 입장을 대변하지 않습니다. Followme는 제공된 정보의 정확성, 완전성 또는 신뢰성에 대해 책임을 지지 않으며, 서면으로 명시적으로 언급되지 않는 한 해당 내용을 기반으로 취해진 어떠한 조치에 대해서도 책임을 지지 않습니다.

