


Now on to the good stuff: Just how profitable is each technical indicator on its own?
After all, forex traders don’t include these technical indicators just to make their charts look nicer. Traders are in the business of making money!
If these indicators generate signals that don’t translate into a profitable bottom line over time, then they’re simply not the way to go for your needs!
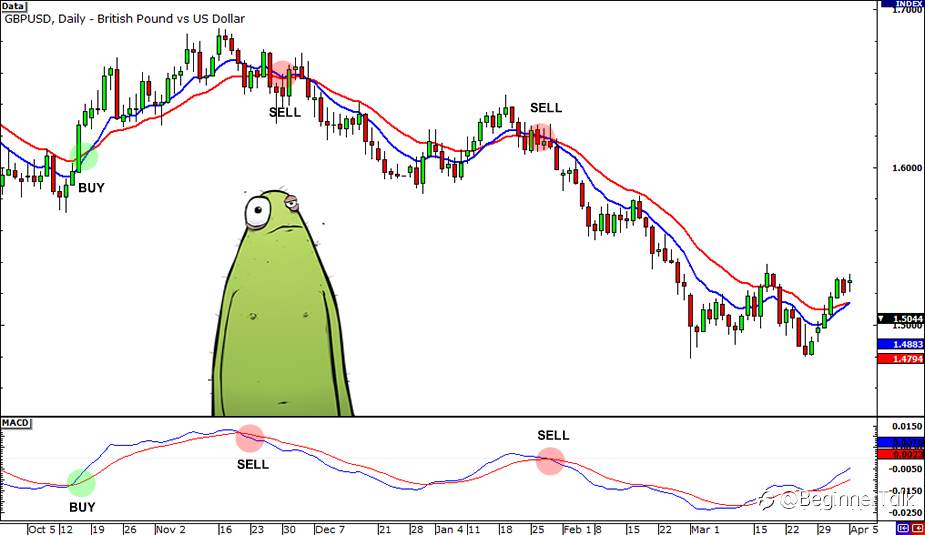
In order to give y’all a comparison of the effectiveness of each technical indicator, we’ve decided to backtest each of the indicators on their own for the past 5 years.
Backtesting involves retroactively testing the parameters of the indicators against historical price action.
You’ll learn more about this in your future studies. For now, just take a look at the parameters we used for our backtest.
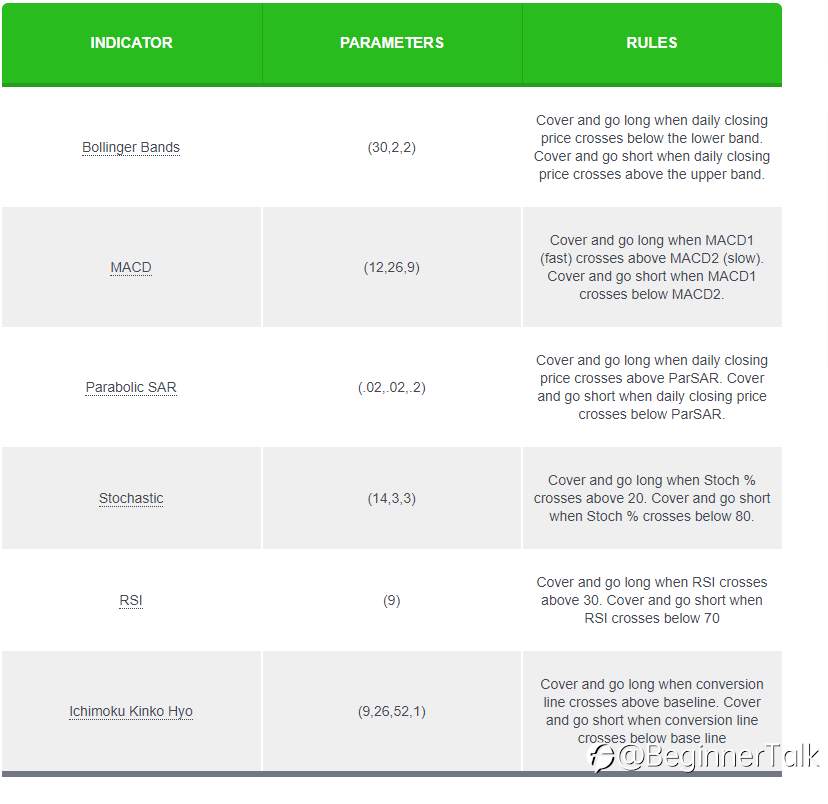
Using these parameters, we tested each of the technical indicators on its own on the daily time frame of EUR/USD over the past 5 years.
We are trading 1 lot (that’s 100,000 units) at a time with no set stop losses or take profit points.
We simply cover and switch position once a new signal appears. This means if we initially had a long position when the indicator told us to sell, we would cover and establish a new short position.Also, we were assuming we were well capitalized (as suggested in our Leverage lesson) and started with a hypothetical balance of $100,000.
Aside from the actual profit and loss of each strategy, we included total pips gained/lost and the max drawdown.
Again, let us just remind you that we DO NOT SUGGEST trading forex without any stop losses. This is just for illustrative purposes only! Moving on, here are the results of our backtest:
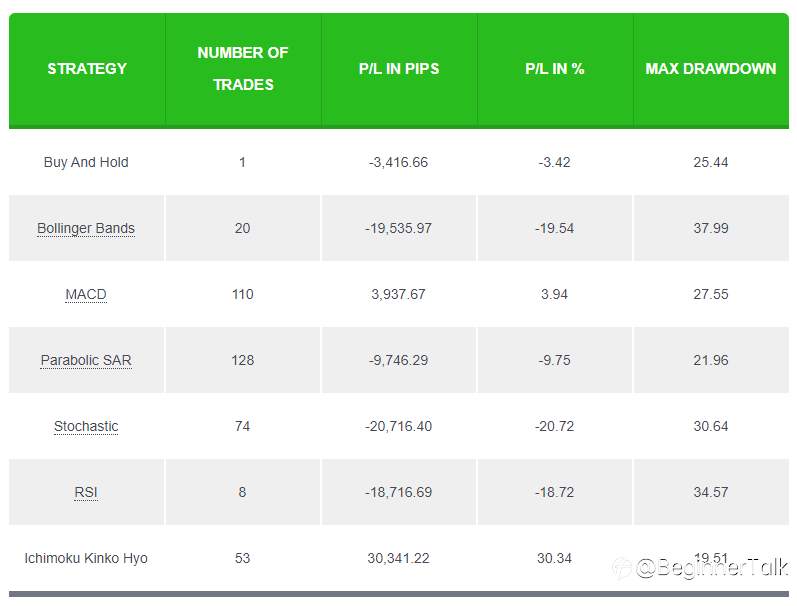
The data showed that over the past 5-years, the indicator that performed the best on its own was the Ichimoku Kinko Hyo indicator.
It generated a total profit of $30,341, or 30.35%. Over 5 years, that gives us an average of just over 6% per year!Surprisingly, the rest of the technical indicators were a lot less profitable, with the Stochastic indicator showing a return of negative 20.72%.
Furthermore, all of the indicators led to substantial drawdowns of between 20% to 30%.
However, this does not mean that the Ichimoku Kinko Hyo indicator is the best or that technical indicators as a whole are useless. Rather, this just goes to show that they aren’t that useful on their own.
Think of all those martial arts movies you watched growing up. Aside from The Rock and the People’s Elbow, no one relied on just one move to beat all the bad guys. The Rock used a combination of moves to get the job done.
Forex trading is similar. It is an art and as traders, we need to learn how to use and combine the tools at hand in order to come up with a system that works for us. This brings us to our next lesson: putting all these indicators together!
Reprinted from Babypips,the copyright all reserved by the original author.
편집됨
면책 조항: 본 게시글에 표현된 견해는 전적으로 작성자의 견해이며 Followme의 공식 입장을 대변하지 않습니다. Followme는 제공된 정보의 정확성, 완전성 또는 신뢰성에 대해 책임을 지지 않으며, 서면으로 명시적으로 언급되지 않는 한 해당 내용을 기반으로 취해진 어떠한 조치에 대해서도 책임을 지지 않습니다.

