-
The XAU/USD chart was unable to break above the resistance trend line (orange) and is now testing the support trend line (green).
-
Price action seems to be building 3 corrective waves down after 5 impulsive waves up. Now an ABC zigzag pattern seems to be taking place in wave 2 or B.
-
The target is the previous top. A break below the 100% Fib places the bullish ABC or 123 (pink) on hold (orange sign).
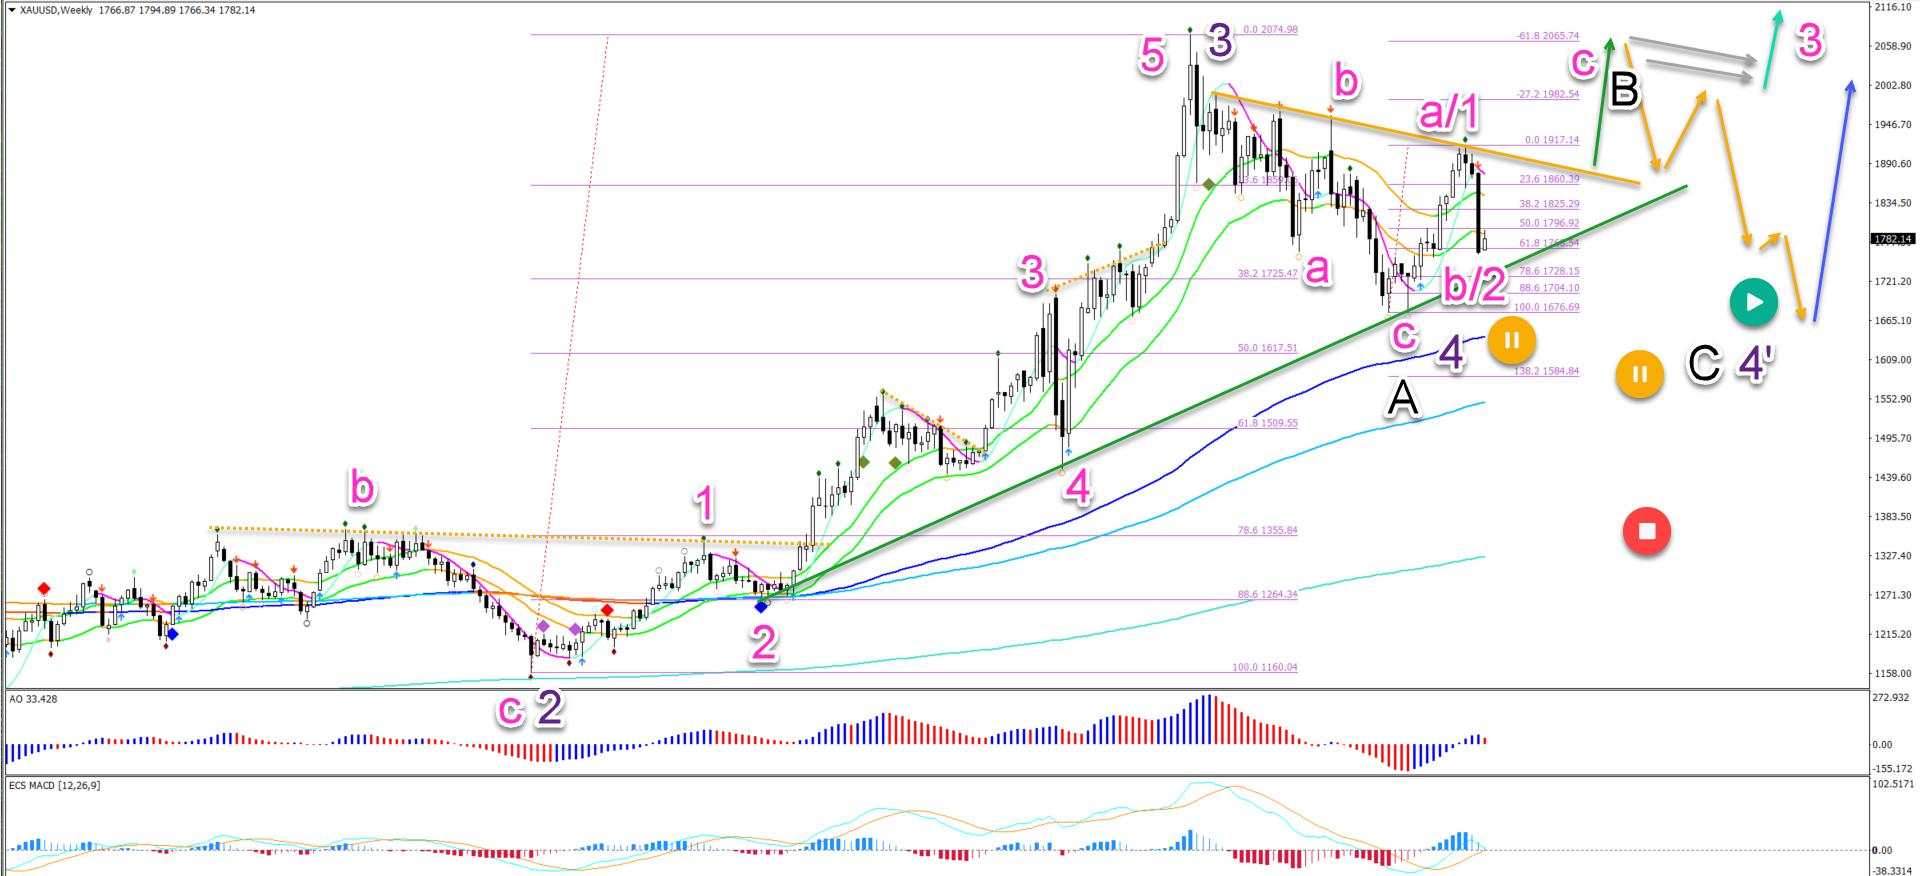
The XAU/USD (Gold) weekly chart made a bearish reversal contrary to our previous analysis. This indicates that price action has either completed a wave 1 or A (pink).
This article analyzes what to expect from the wave 4 retracement (purple).
Price charts and technical analysis
The XAU/USD chart was unable to break above the resistance trend line (orange) and is now testing the support trend line (green):
-
A bullish bounce at the support line (green) and 61.8%, 78.6% or 88.6% Fibonacci retracement levels of the wave B/2 (pink) could confirm one more bullish swing.
-
The target is the previous top. A break below the 100% Fib places the bullish ABC or 123 (pink) on hold (orange sign).
-
If price action gets close to the previous top, then the price reaction will be very important.
-
A bull flag (grey arrows) pattern could indicate more uptrend (aqua blue arrow).
-
A bearish reversal (orange arrows) could indicate a bearish ABC (black) pattern in wave 4’ (purple).
-
Any deeper retracement places the uptrend on hold (orange and red signs).
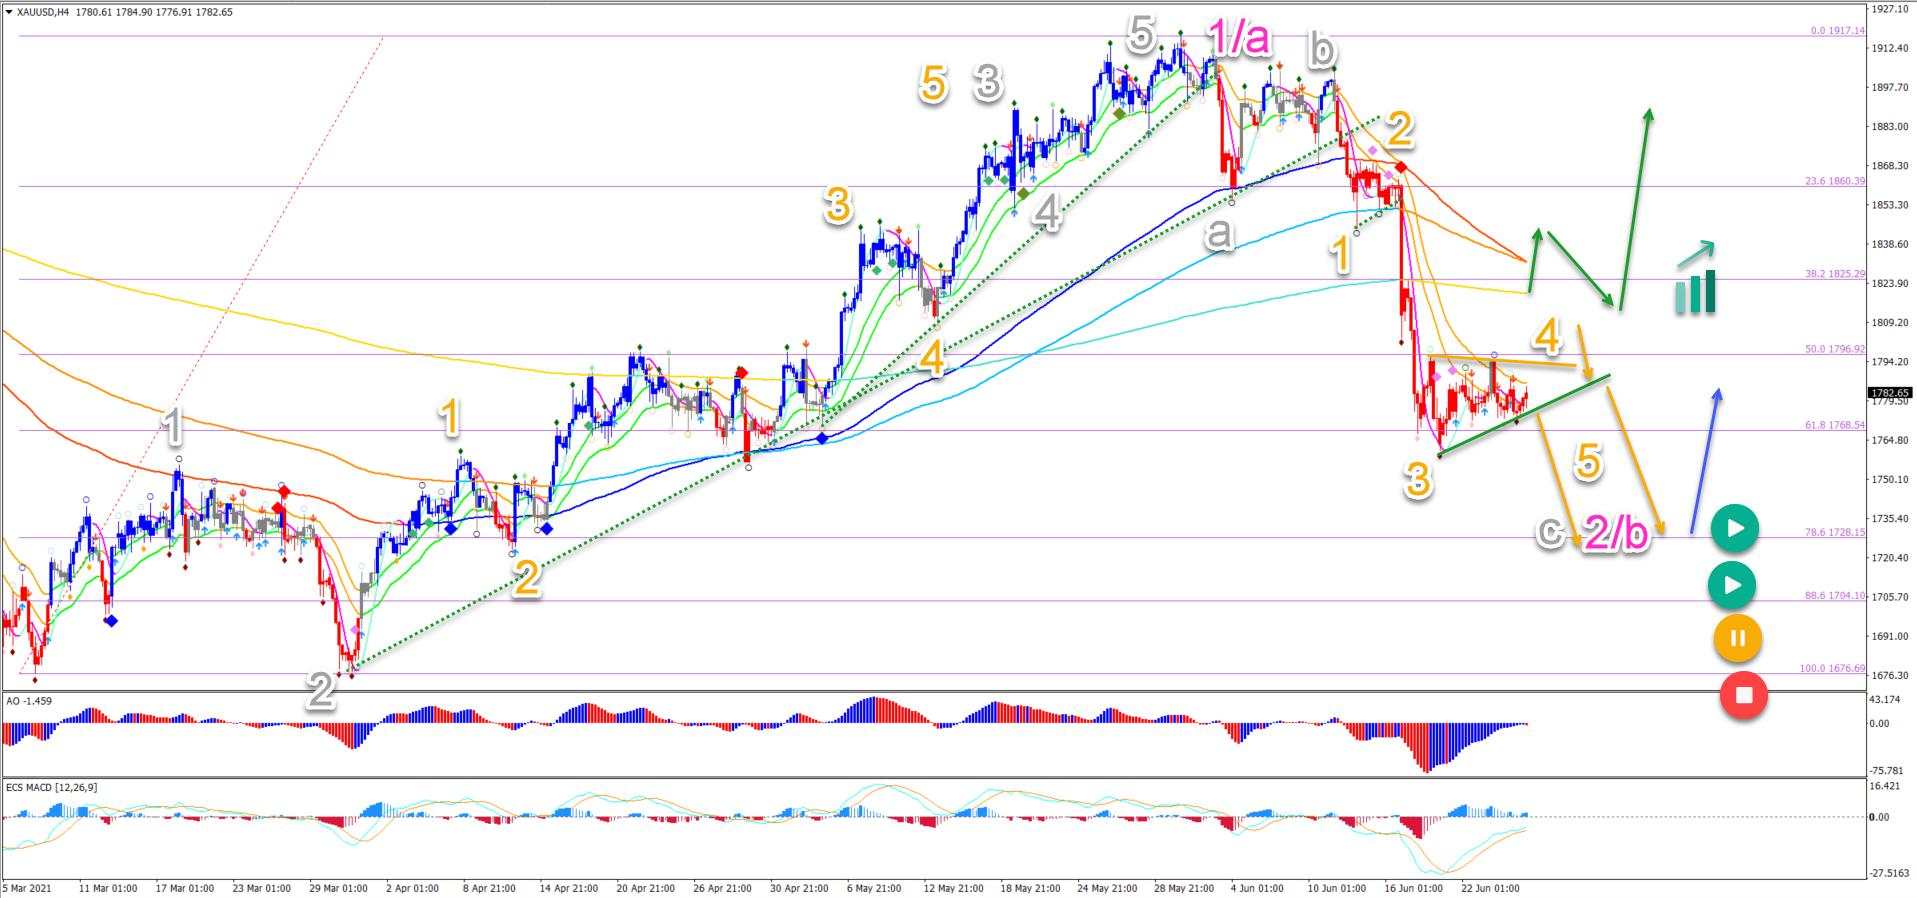
On the 4 hour chart, price action seems to be building 3 corrective waves down after 5 impulsive waves up:
-
The 5 bullish waves (grey) completed a wave 1 or A (pink).
-
Now an ABC (grey) zigzag pattern seems to be taking place in wave 2 or B (pink).
-
A bearish breakout (orange arrows) below the support line (green) could aim at the 78.6% Fibonacci level.
-
A bullish bounce (blue arrow) at the deep Fibonacci retracement levels is expected.
-
A bullish breakout above the long-term moving averages could indicate the end of the bearish ABC (grey) as well and the start of a bullish price swing.
The analysis has been done with the ecs.SWAT method and ebook.
원저자가 모두 저작권을 보유한 FXStreet에서 재 인쇄 함.
면책 조항: 본 게시글에 표현된 견해는 전적으로 작성자의 견해이며 Followme의 공식 입장을 대변하지 않습니다. Followme는 제공된 정보의 정확성, 완전성 또는 신뢰성에 대해 책임을 지지 않으며, 서면으로 명시적으로 언급되지 않는 한 해당 내용을 기반으로 취해진 어떠한 조치에 대해서도 책임을 지지 않습니다.

더 오래된 의견은 없습니다. 소파를 가장 먼저 잡으십시오.