Candlestick patterns tell the story of buyers and sellers. If you can read them, you can predict market movement. Learn the top patterns every trader must know
Mastering Candlestick Patterns: The Language of the Forex Market
Candlestick patterns are the foundation of technical analysis. Every candle shows a battle between buyers and sellers, and these patterns reveal where the market may go next.
If you want to improve your entries, reduce losses, and catch big moves — learn candlesticks first.
🔹 What is a Candlestick?
Each candlestick represents:
- Open price
- Close price
- High & Low
A bullish candle (green or white) shows price went up.
A bearish candle (red or black) shows price went down.
Candles create patterns that repeat thousands of times in the market.

🔹 Why Candlestick Patterns Matter
Candlesticks show:
✔ Market strength
✔ Reversals
✔ Trend continuation
✔ Momentum shifts
✔ Entry & exit signals
Professional traders rely heavily on candlestick signals before taking trades.

🔥 TOP 5 CANDLESTICK PATTERNS EVERY TRADER MUST KNOW
1. Bullish Engulfing Pattern (Strong Buy Signal)
This pattern forms at the bottom of a downtrend.
A small red candle is followed by a big green candle that “engulfs” it.
It signals that buyers have taken control.
Use it to:
- Enter bullish trades
- Spot reversals early
2. Bearish Engulfing Pattern (Strong Sell Signal
Opposite of the bullish engulfing.
A big bearish candle takes over a small bullish candle.
Indicates downward reversal.
Use it at resistance or after a big up move.
3. Hammer (Bullish Reversal)
The hammer appears after a downtrend.
Features:
- Small body
- Long lower wick
- Indicates sellers tried to push price down but failed
Great buy signal when confirming with support.
4. Shooting Star (Bearish Reversal)
Opposite of the hammer.
Appears after an uptrend.
Shows buyers failed to push higher, giving control to sellers.
Best used near resistance.
5. Doji (Indecision Signal)
A doji forms when the open and close price are nearly the same.
Meaning:
- Market is undecided
- Reversal might happen
- Trend is slowing down
Doji + support/resistance = powerful signal.
🔍 How to Use Candlestick Patterns in Trading
Candlestick patterns alone are not enough.
They are most powerful when combined with:
✔ Support & Resistance
✔ Trend direction
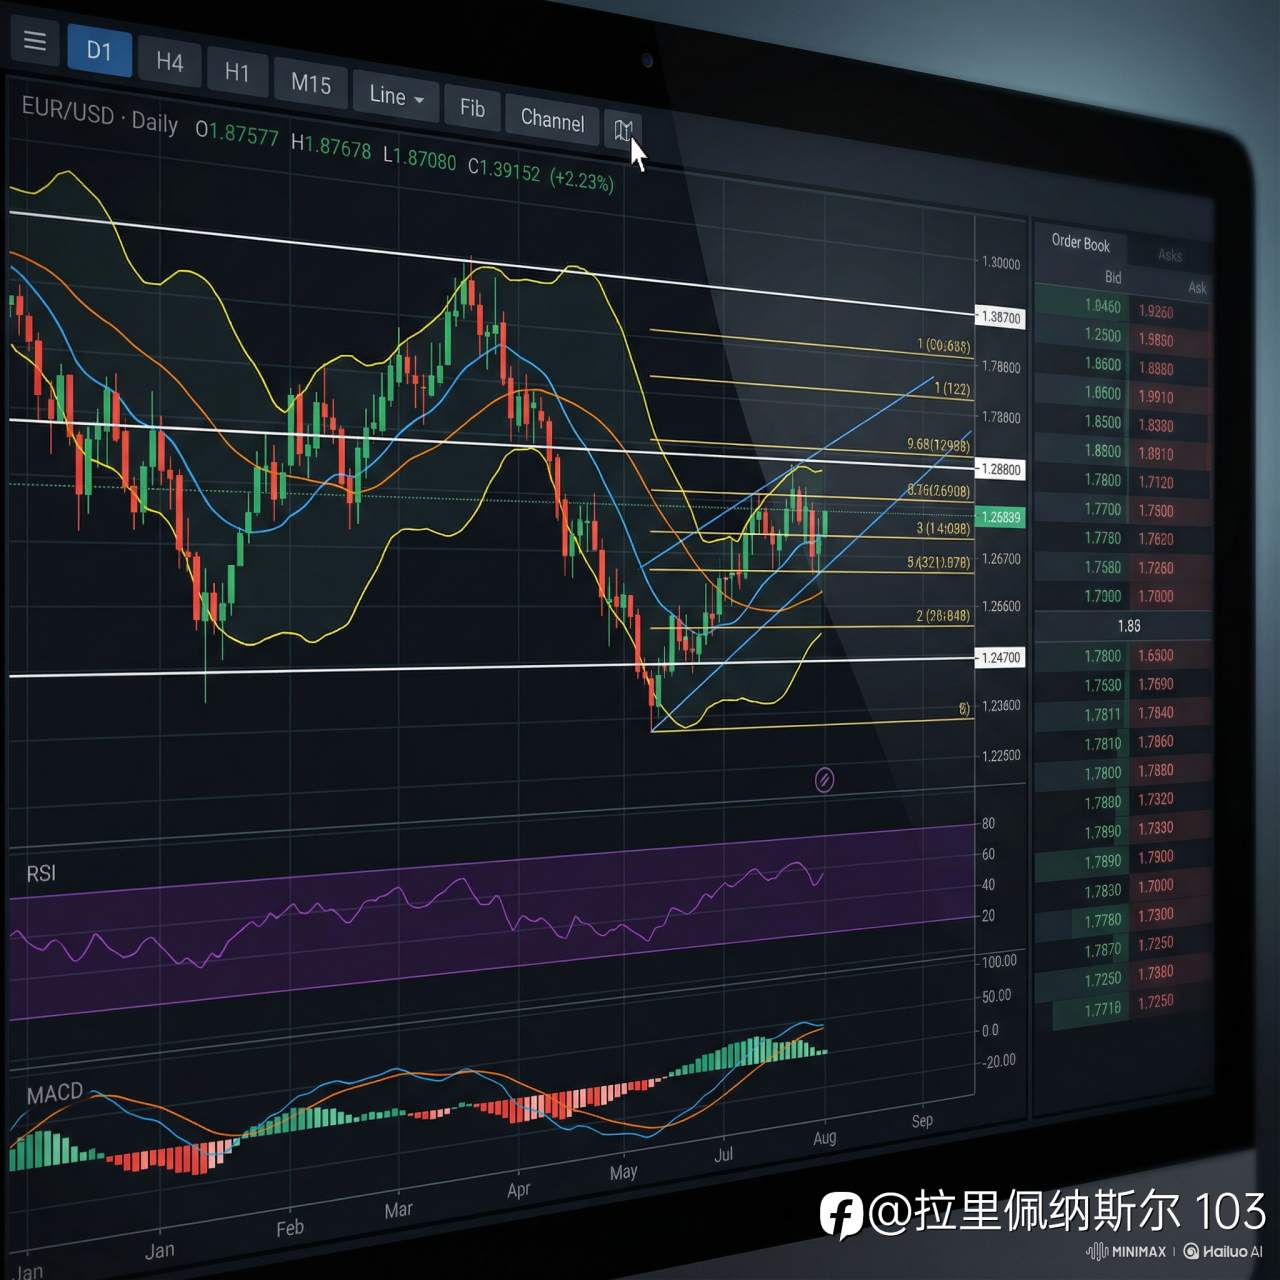
✔ RSI / MACD
✔ Market structure
Rule:
“Never trade a candle pattern against the trend.”
🔧 Practical Trading Tips
✔ Use higher timeframes (H1, H4, D1)
More accurate, less noise.
✔ Always confirm with market structure
Is the trend really changing?
✔ Strict stop loss placement
Below wick for bullish setups.
Above wick for bearish setups.
✔ Avoid trading during high-impact news
Candles become unpredictable.
🧠 Conclusion
Candlestick patterns are the most important skill for any Forex trader.
They reveal the psychology of the market and help you predict reversals and strong moves before they happen.
If you master these patterns, your entries will improve, your losses will shrink, and your confidence will grow.
면책 조항: 본 게시글에 표현된 견해는 전적으로 작성자의 견해이며 Followme의 공식 입장을 대변하지 않습니다. Followme는 제공된 정보의 정확성, 완전성 또는 신뢰성에 대해 책임을 지지 않으며, 서면으로 명시적으로 언급되지 않는 한 해당 내용을 기반으로 취해진 어떠한 조치에 대해서도 책임을 지지 않습니다.

- 끝 -