
| Scenario | |
|---|---|
| Timeframe | Weekly |
| Recommendation | BUY STOP |
| Entry Point | 158.00 |
| Take Profit | 175.00, 187.50, 200.00 |
| Stop Loss | 145.00 |
| Key Levels | 100.00, 112.50, 132.00, 157.40, 175.00, 187.50, 200.00 |
| Alternative scenario | |
|---|---|
| Recommendation | SELL STOP |
| Entry Point | 131.00 |
| Take Profit | 112.50, 100.00 |
| Stop Loss | 144.00 |
| Key Levels | 100.00, 112.50, 132.00, 157.40, 175.00, 187.50, 200.00 |
Current trend
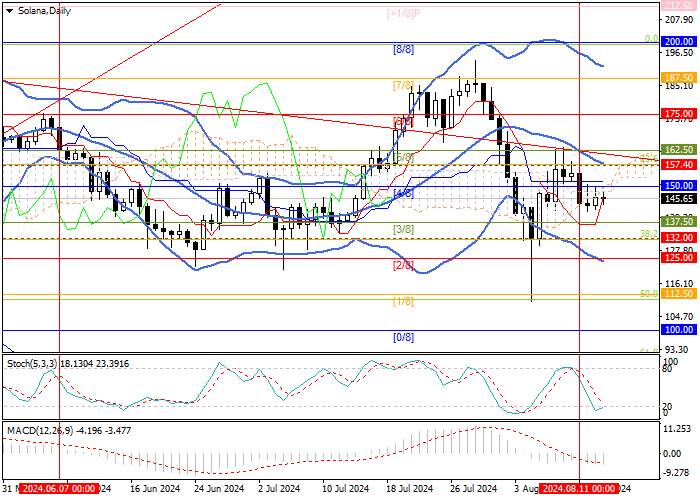
The SOL/USD pair is trying to regain lost ground after the weekend decline, currently holding at 150.00 (Murrey level [4/8]), but is unable to break above it yet.
Investors are in no hurry to open new positions; however, medium-term fundamental factors remain positive for the SOL/USD pair. Thus, they expect that the next digital exchange-traded instrument approved by the US Securities and Exchange Commission (SEC) will be an ETF based on Solana. Recall that last month, VanEck and 21Shares filed applications to the regulator to register new funds, and Bloomberg analysts expect that they can be considered by March next year. It is worth noting that just recently the Brazilian Securities and Exchange Commission (CVM) gave permission to launch Solana-ETF in the country, and now the instrument is awaiting listing on the stock exchange.
The SOL/USD pair is being strengthened by hopes for increased adoption of the stablecoin from payment giant PayPal Inc., which is also based on Solana. In addition, the July data on the US consumer price index (CPI), which will be published today at 14:30 (GMT 2), is expected to confirm the downtrend in inflationary pressures in the economy, which will open the way for the US Federal Reserve to make a larger-than-expected interest rate adjustment in September by as much as ˗50 basis points. Thus, the American currency may find itself under even greater pressure against alternative assets.
Support and resistance
The price approached the resistance zone of 150.00–157.40 (Murrey level [4/8], 23.6% Fibonacci retracement, the central line of Bollinger Bands), consolidation above which will ensure continued growth to the targets of 175.00 (Murrey level [6/8]), 187.50 (Murrey level [7/8]), 200.00 (Murrey level [8/8]). The key mark for the “bears” seems to be 132.00 (38.2% Fibonacci retracement), consolidation below which will lead to the development of a decline to the levels of 112.50 (Murrey level [1/8]), 100.00 (Murrey level [0/8]).
Technical indicators do not give a clear signal: Bollinger Bands are reversing down and MACD is stable in the negative zone, which confirms the formation of a short-term downtrend, but Stochastic is reversing up from the oversold zone, which doesn’t exclude further growth.
Resistance levels: 157.40, 175.00, 187.50, 200.00.
Support levels: 132.00, 112.50, 100.00.
Trading tips
Long positions can be opened above the level of 157.40 with targets at 175.00, 187.50, 200.00 and stop-loss at 145.00. Implementation period: 5–7 days.
Short positions can be opened below the 132.00 mark with targets at 112.50, 100.00 and stop-loss at 144.00.
면책 조항: 본 게시글에 표현된 견해는 전적으로 작성자의 견해이며 Followme의 공식 입장을 대변하지 않습니다. Followme는 제공된 정보의 정확성, 완전성 또는 신뢰성에 대해 책임을 지지 않으며, 서면으로 명시적으로 언급되지 않는 한 해당 내용을 기반으로 취해진 어떠한 조치에 대해서도 책임을 지지 않습니다.

더 오래된 의견은 없습니다. 소파를 가장 먼저 잡으십시오.