Hello traders. In this post, we will analyze the NIFTY-50 price chart. The Nifty 50 includes 50 major companies listed on the National Stock Exchange (NSE) of India. It is one of India's two main stock indices, alongside the BSE Sensex.
NIFTY-50 Elliott Wave Analysis - Weekly Chart
NIFTY 50 is in a long-term bullish cycle on the monthly chart. On the weekly chart, the current bullish sub-cycle began in March 2020 when wave ((II)) grand supercycle ended. From a low of 7525.04, the index started the grand supercycle wave ((III)) and has been rising since then. The sub-waves of ((III)) show the price completed supercycle waves (I) and (II) in October 2021 and June 2022. Now, the price is rising in an impulse structure for wave (III).

The weekly chart above shows the index is on wave (5) of ((3)) of I of (III) of ((III)). Thus, the bullish trend has a long way to go. This is a clear bullish sequence. Buyers will look to buy pullbacks of ((4)) after the ((3)) high is confirmed. Alternatively, buyers can find opportunities at wave 2 and 4 pullbacks within the wave (5) sub-structure before ((3)) ends. To trade the sub-waves of (5), traders should check the daily or H4 chart.
NIFTY-50 Elliott Wave Analysis - H4 Chart
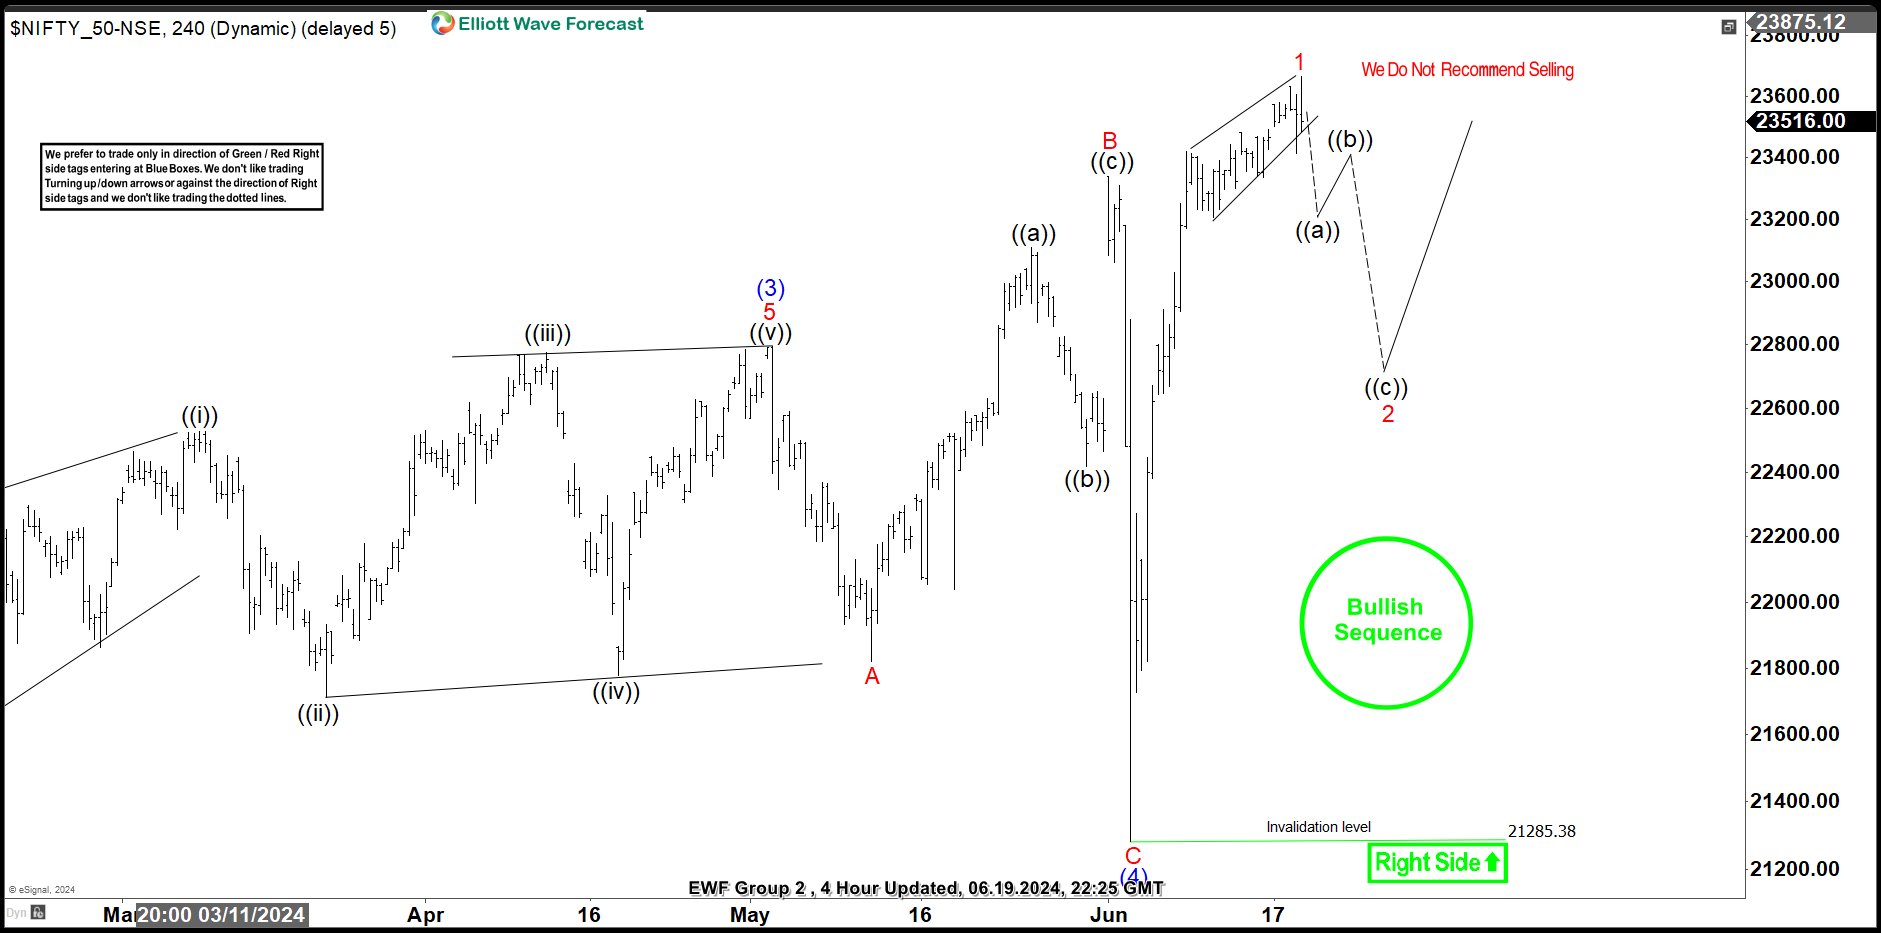
We shared the H4 chart with Elliottwave-Forecast group 2 members on 06.19.2024. Members received this chart at the end of the trading day along with H4 charts of 25 other instruments. In the members’ area, we cover 78 instruments in three groups of 26 each, including Forex, Stocks, Indices, Cryptocurrencies, Commodities, and ETFs.
The H4 chart shows wave 1 of (5) completing an impulse wave structure with the 5th sub-wave forming an ending diagonal. Ending diagonals are powerful reversal patterns in technical analysis. If prices break the lower boundary of the diagonal, confirming the end of wave 1, we can expect a corrective pullback for wave 2. Therefore, our focus on the H4 chart is to buy at the end of wave 2, not sell into wave 2. The trend is bullish, and we follow where the big players trade. We will monitor NIFTY on both the H4 and H1/30 Min charts. We update H1 charts four times a day for all 78 instruments.
면책 조항: 본 게시글에 표현된 견해는 전적으로 작성자의 견해이며 Followme의 공식 입장을 대변하지 않습니다. Followme는 제공된 정보의 정확성, 완전성 또는 신뢰성에 대해 책임을 지지 않으며, 서면으로 명시적으로 언급되지 않는 한 해당 내용을 기반으로 취해진 어떠한 조치에 대해서도 책임을 지지 않습니다.

더 오래된 의견은 없습니다. 소파를 가장 먼저 잡으십시오.