


Hello fellow traders. In this technical article we’re going to take a look at the Elliott Wave charts charts of RUSSELL Futures $RTY_F published in members area of the website. As our members know we are favoring the long side in Indices. $RTY is another instrument that has given us good trading setup recently. RUSSELL made clear 3 waves down from the March 8th peak peak and completed correction right at the Equal Legs zone ( Blue Box Area) . In further text we’re going to explain the Elliott Wave pattern and trading setup.
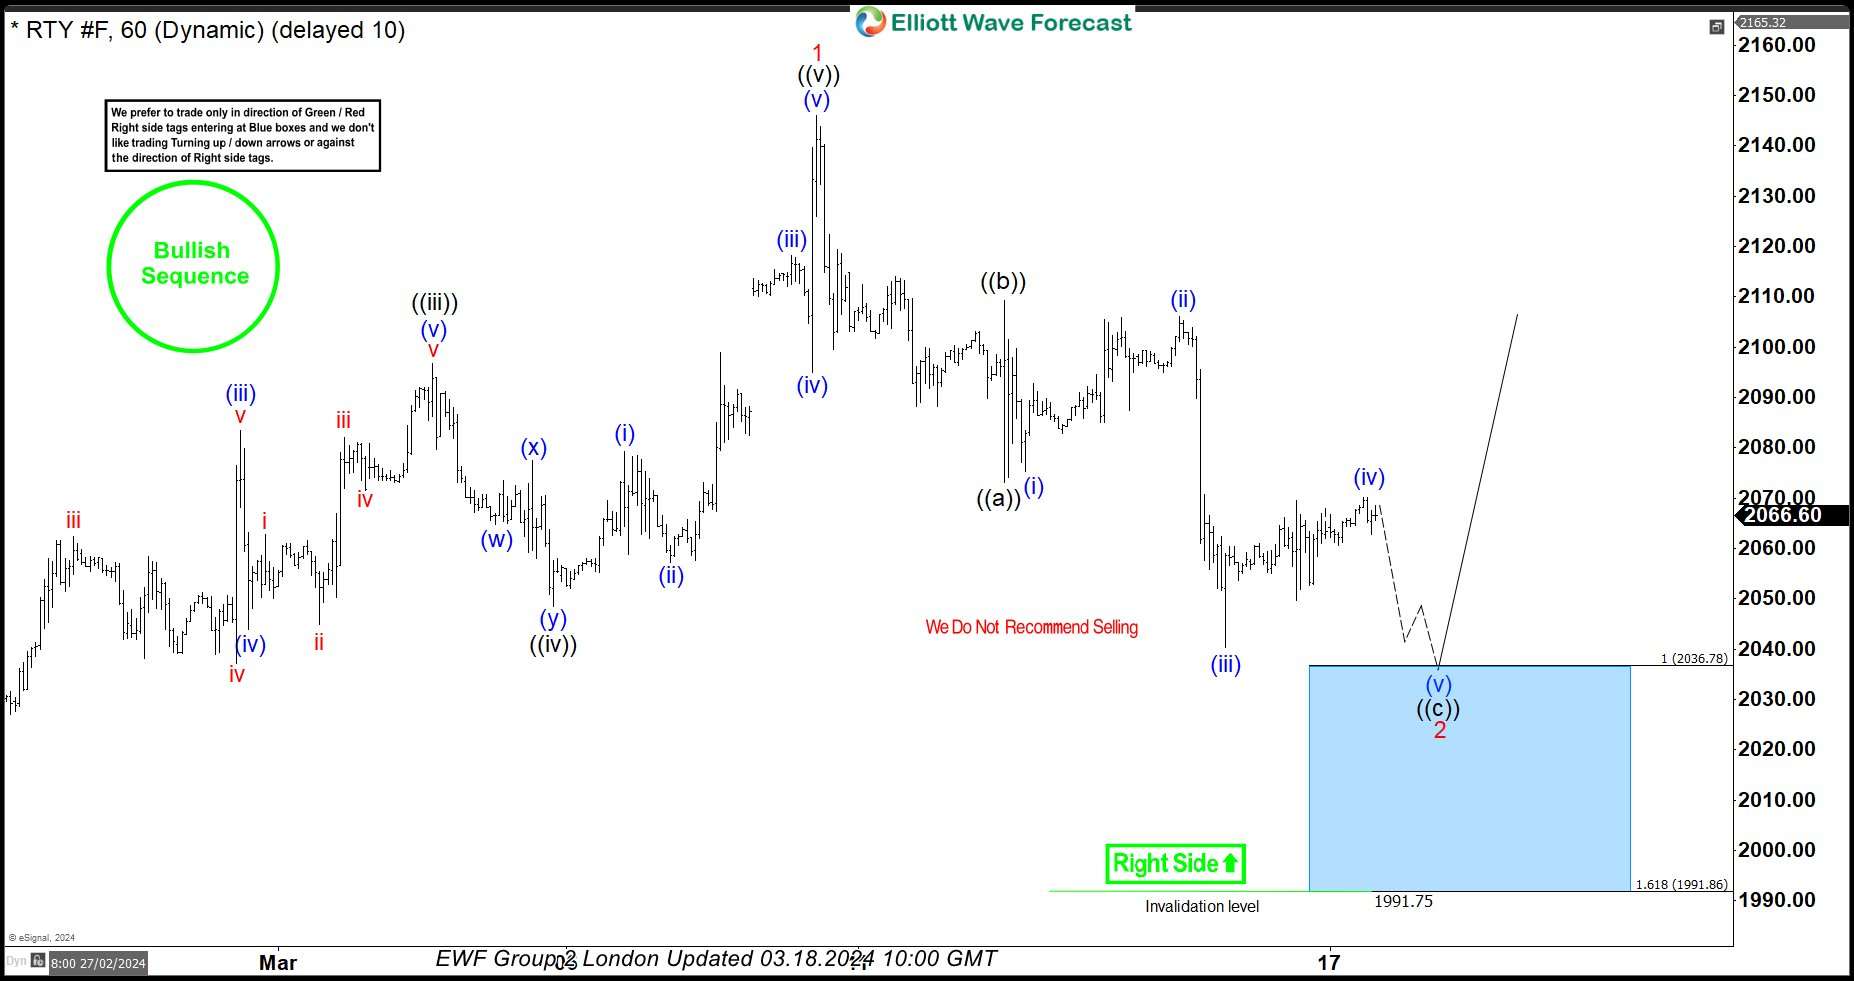
RUSSELL Elliott Wave 1 Hour Chart 03.18.2024
RUSSELL is showing lower low sequences from the peak, suggesting short term pull back is still in progress. Correction has ((a))((b))((c)) labeling. The price structure is incomplete at the moment, calling for another leg down toward : 2036.78-1991.86. We don’t recommend selling RTY_F and prefer the long side from the marked Blue Box ( buying zone). Once RUSSELL reaches our buying area, it should ideally make either rally toward new highs or in 3 waves bounce alternatively. Once bounce reaches 50 Fibs against the ((b)) black high, we will make long position risk free ( put SL at BE) and take partial profits.
Official trading strategy on How to trade 3, 7, or 11 swing and equal leg is explained in details in Educational Video, available for members viewing inside the membership area.
Quick reminder on how to trade our charts :
Red bearish stamp+ blue box = Selling Setup
Green bullish stamp+ blue box = Buying Setup
Charts with Black stamps are not tradable. 🚫
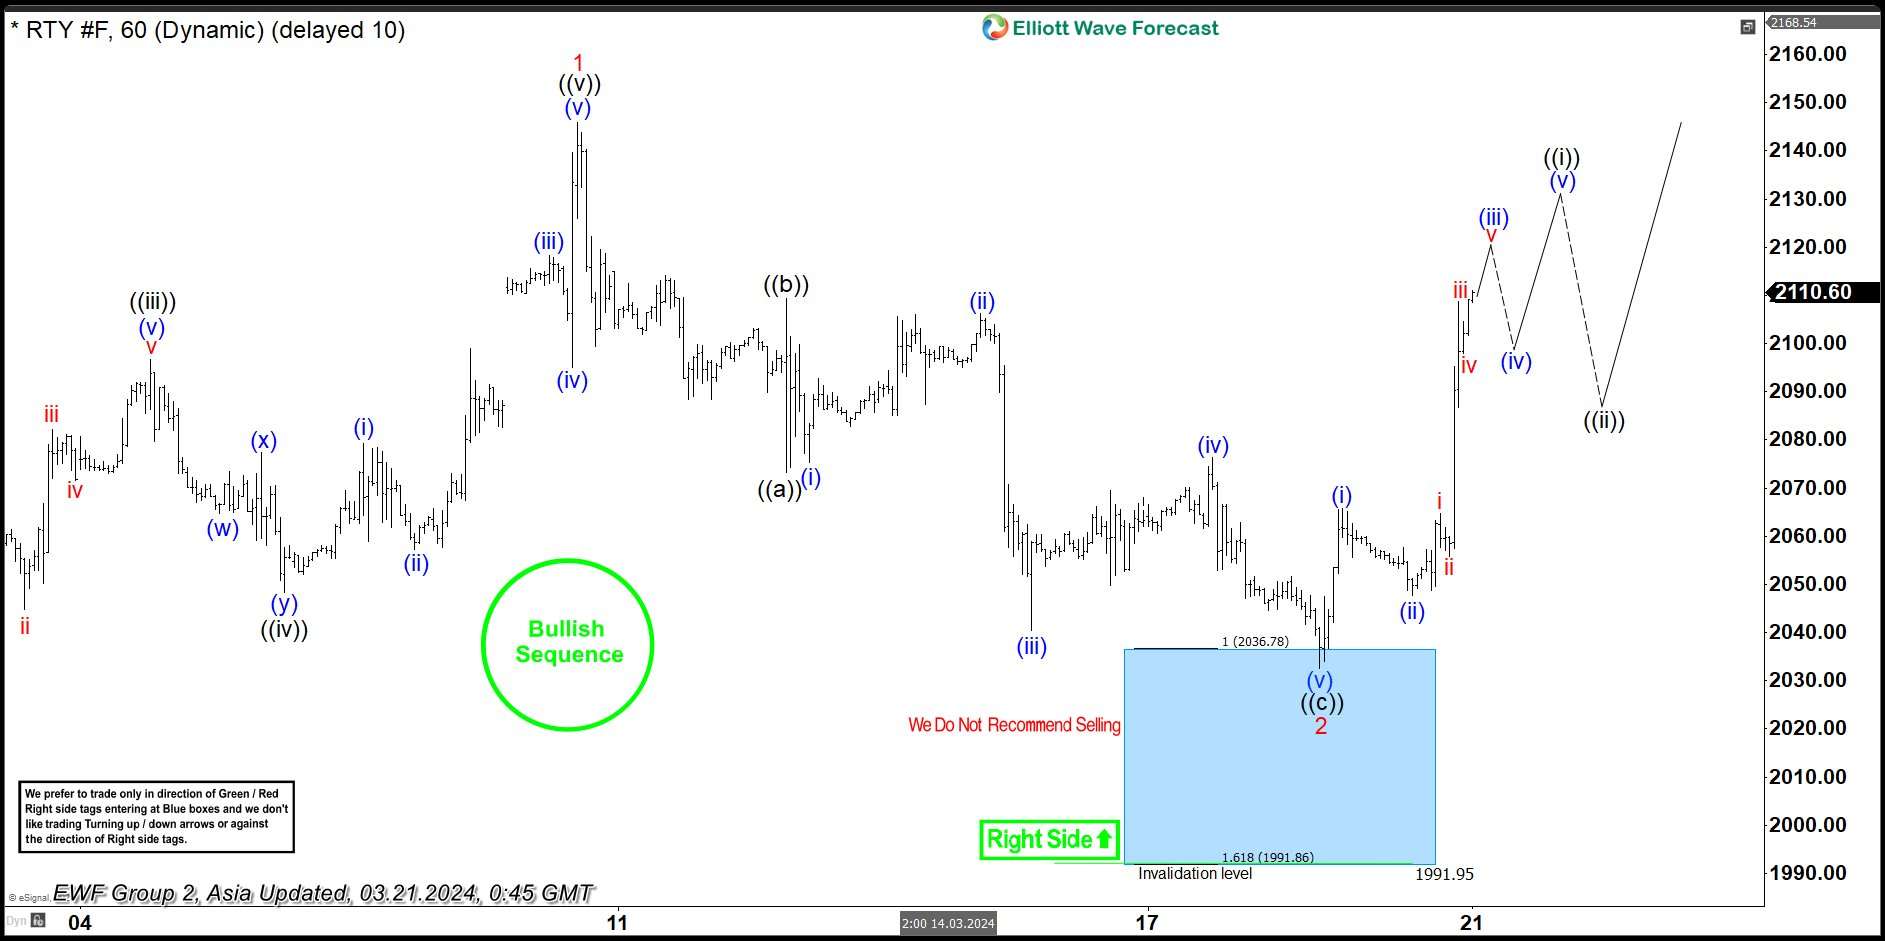
RUSSELL Elliott Wave 1 Hour Chart 02.28.2024
RUSSELL reached our buying zone at : 2036.78-1991.86 and found buyers as expected. RTY_F is giving us very good reaction from the Blue Box Area. We call pull back 2 red completed at the 2033.3 low. Consequently, any long positions should be risk free by now. We would like to see break of 1 red peak (March 8th) to confirm next leg up is in progress. Once it breaks above 03.08. peak, we can look to buy intraday dips again in 3,7,11 swings against the 2033.3 low
Keep in mind that market is dynamic and presented view could have changed in the mean time. You can check most recent charts with target levels in the membership area of the site. Best instruments to trade are those having incomplete bullish or bearish swings sequences. We put them in Sequence Report and best among them are shown in the Live Trading Room
New to Elliott Wave ? Check out our Free Elliott Wave Educational Web Page and download our Free Elliott Wave Book.
면책 조항: 본 게시글에 표현된 견해는 전적으로 작성자의 견해이며 Followme의 공식 입장을 대변하지 않습니다. Followme는 제공된 정보의 정확성, 완전성 또는 신뢰성에 대해 책임을 지지 않으며, 서면으로 명시적으로 언급되지 않는 한 해당 내용을 기반으로 취해진 어떠한 조치에 대해서도 책임을 지지 않습니다.

더 오래된 의견은 없습니다. 소파를 가장 먼저 잡으십시오.