*Previous Trading Session*
• On Tuesday, Gold price extended its daily uptrend and rose to a fresh multi-week high above $2,060.
• The benchmark 10-year US Treasury bond yield stays in negative territory below 3.9% after soft US PCE inflation data, allowing XAU/USD to gather bullish momentum.
*Current Situation*
• The gold has shown a strong bullish momentum during Tuesday’s early Asian Session, despite the steady US dollar.
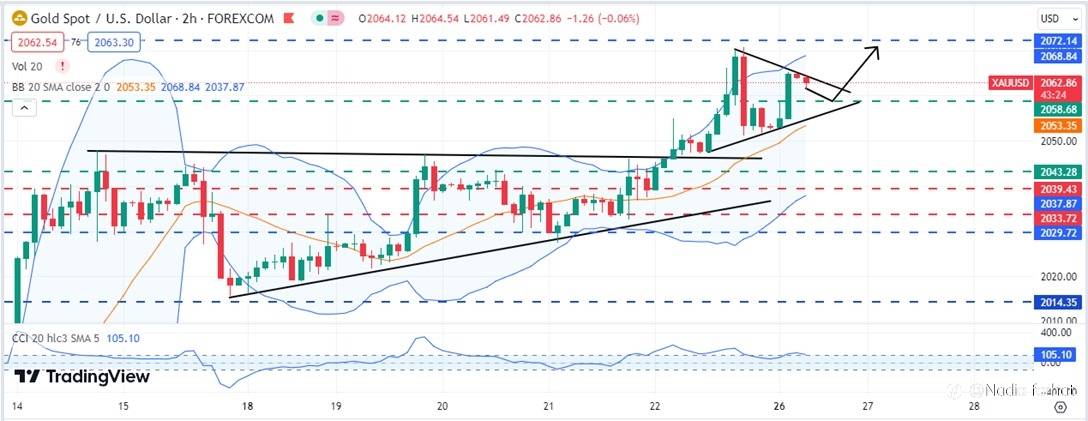
• Gold extended the previous week’s strength and it retested the upper trend line of the symmetrical triangle pattern as the day began on Tuesday post-Christmas Holiday.
• Gold currently consolidating at the upper trend line of the triangle pattern – signaling further bullishness. However, it is crucial for gold to give a higher breakout out of the triangle to test higher resistance levels.
• Currently XAU/USD is hovering near 2064.88
*Analysis*
• The gold seems to be driven by the weakness in US dollar.
• The 10-year U.S. Treasury yield on Wednesday hit its lowest level since July. The yield on the benchmark 10-year Treasury note fell 7 basis points to 3.849%. On July 27, the 10-year yielded as low as 3.839%.
• Further, Sticky inflation in Euro Zone raise probabilities of further rate hikes, which has negatively impact dollar prices.
• Safe-haven demand for gold increased amid a significant selloff in equities, and due to the escalation of terrorist activities in Red Sea – a major maritime trade route.
*Technical Indicators:*
• Gold continues to trend in the bullish zone as per technical indicators.
• Gold on Tuesday hovers above the middle band of the Bollinger Band as visible on the attached H4 chart.
• The CCI levels also lies above the 0.0 level near 112 levels.
• As per the technical indicators, the prices are expected to take a minor correction before resuming its bullish trajectory.
*Important Levels to Watch*
• Resistance: A bullish acceptance above the symmetrical triangle pattern, intraday highs of 2065.15 will drag prices till the 2095 level. Above which, gold price to resume its journey higher toward a new all-time high level.
• Support: To begin a declining trend, it is important that gold gives a daily closing below 2058.68. Below the correction mode will begin with the next support at 2043.29.
#XAU/USD# #gold# #GOLDTODAY# #ChinaGold# #ForexForecast# #Todayanalysis# #analysis# #technicalanalysis# #fundamentalsanalysis# #AnalisisFundamental# #trading# #forextrading# #BeginnerTrader# #NewTraders#
면책 조항: 본 게시글에 표현된 견해는 전적으로 작성자의 견해이며 Followme의 공식 입장을 대변하지 않습니다. Followme는 제공된 정보의 정확성, 완전성 또는 신뢰성에 대해 책임을 지지 않으며, 서면으로 명시적으로 언급되지 않는 한 해당 내용을 기반으로 취해진 어떠한 조치에 대해서도 책임을 지지 않습니다.

더 오래된 의견은 없습니다. 소파를 가장 먼저 잡으십시오.