3M Company (NYSE: MMM) is a globally recognized leader in innovation, manufacturing, and technology solutions. With a rich history spanning over a century, 3M has established itself as a trusted name in various industries. In this article, we will explore the Elliott Wave technical chart to provide an overview for long-term Prospects and potential opportunities that lie ahead for 3M.
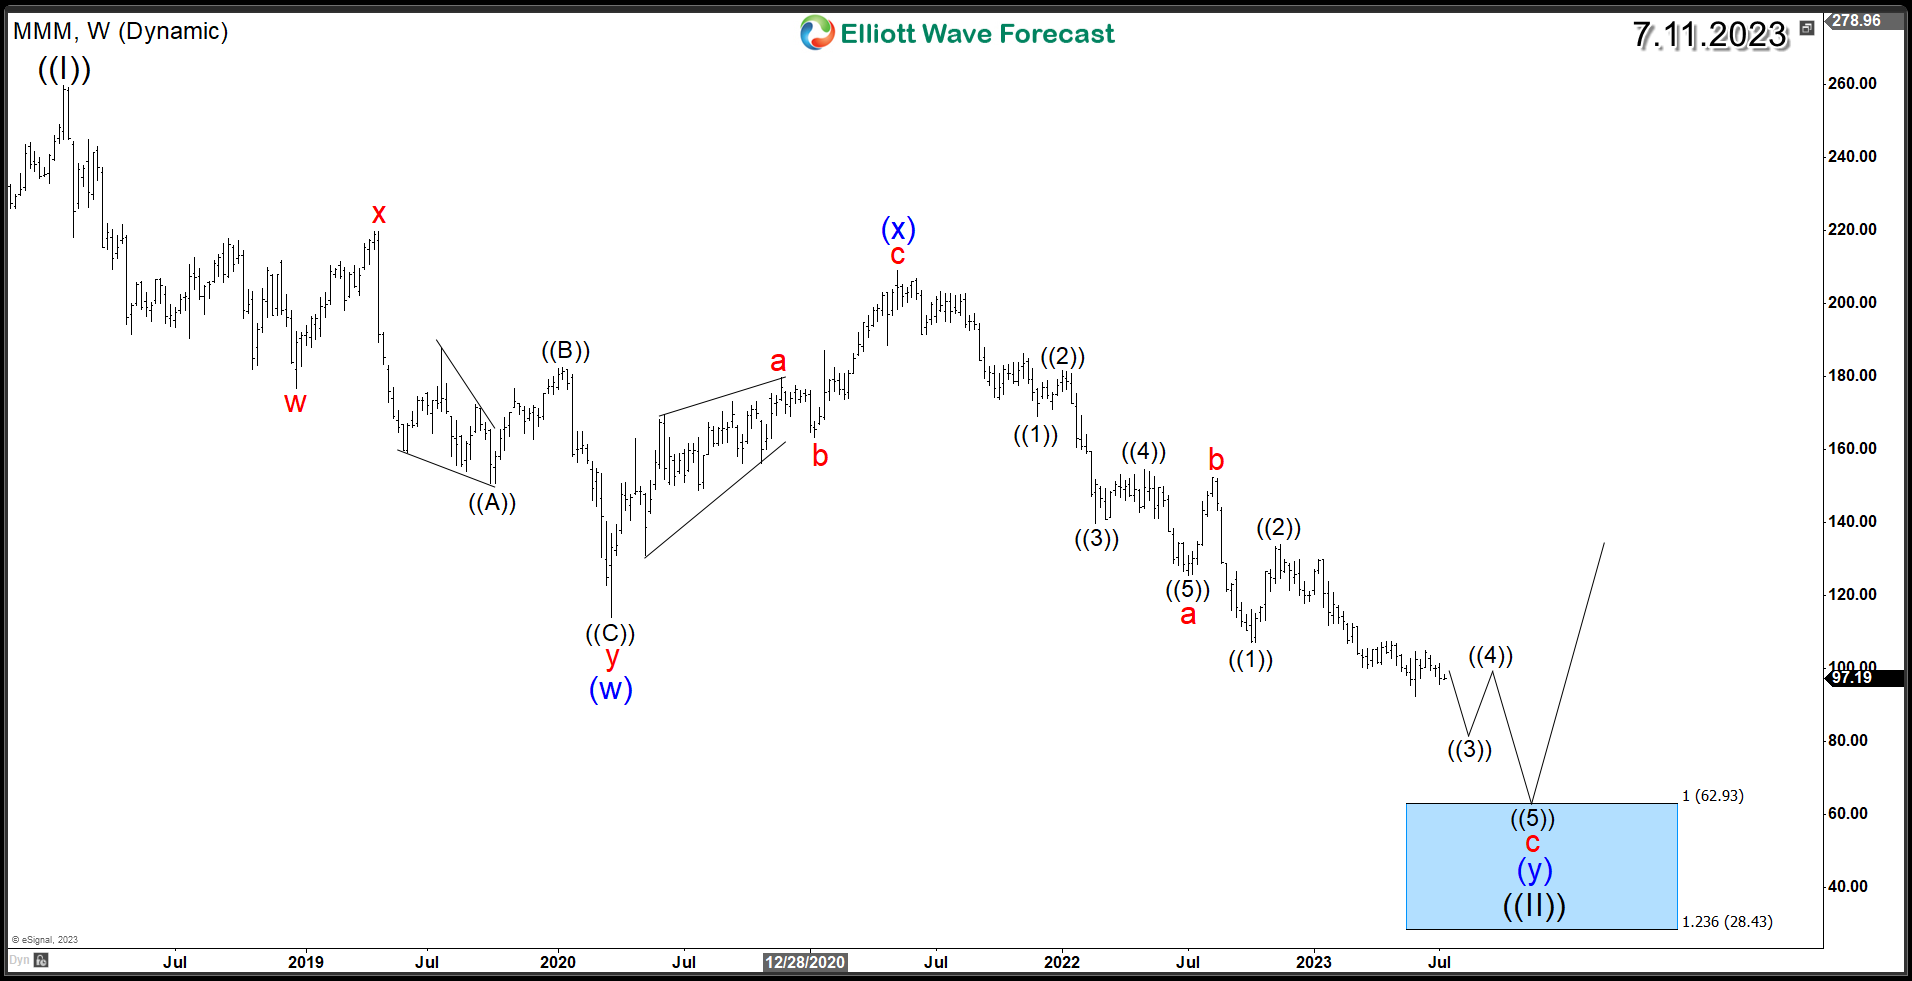
3M is down more than 60% since it's all time high at $259 and it's correcting the grand super cycle. The downtrend that started from January 2018 peak is unfolding as an Elliott Wave Double Three corrective structure which consist of 7 swings. The initial 3 swing of (w) ended in 2020 followed by a connector in wave (x) which market the peak of 2021 similar to the rest of the stock market. Down from there, another 3 swings is taking place aiming for the equal legs area at $62 - $28.
The mentioned area will present the extreme blue box within the weekly cycle, which is a High-frequency area where market is likely to end cycles and make a turn. The stock is expected to bounce higher from there at least in a larger 3 waves to correct the previous decline. Furthermore, if the upward reaction transforms into a strong and impulsive five-wave advance, it has the potential to initiate a new bullish cycle to the upside.
In summary, 3M Company is currently in the final phase of a corrective structure, indicating a potential major bottom on the horizon. As the stock enters the next decline, investors may find a compelling long-term investment opportunity for the years ahead.
3M Weekly Chart
면책 조항: 본 게시글에 표현된 견해는 전적으로 작성자의 견해이며 Followme의 공식 입장을 대변하지 않습니다. Followme는 제공된 정보의 정확성, 완전성 또는 신뢰성에 대해 책임을 지지 않으며, 서면으로 명시적으로 언급되지 않는 한 해당 내용을 기반으로 취해진 어떠한 조치에 대해서도 책임을 지지 않습니다.

더 오래된 의견은 없습니다. 소파를 가장 먼저 잡으십시오.