Royal Caribean has been one of the stronger symbols in the sector. The Symbol ended the Grand Super Cycle back on 01.29.2018 and did a powerful three waves back. The pullback ended on 03.13.2020, and the stock then reacted in five waves off those lows. This suggests at that moment that more upside should happen and the upside should prevail.
RCL Weekly Elliott Wave Chart
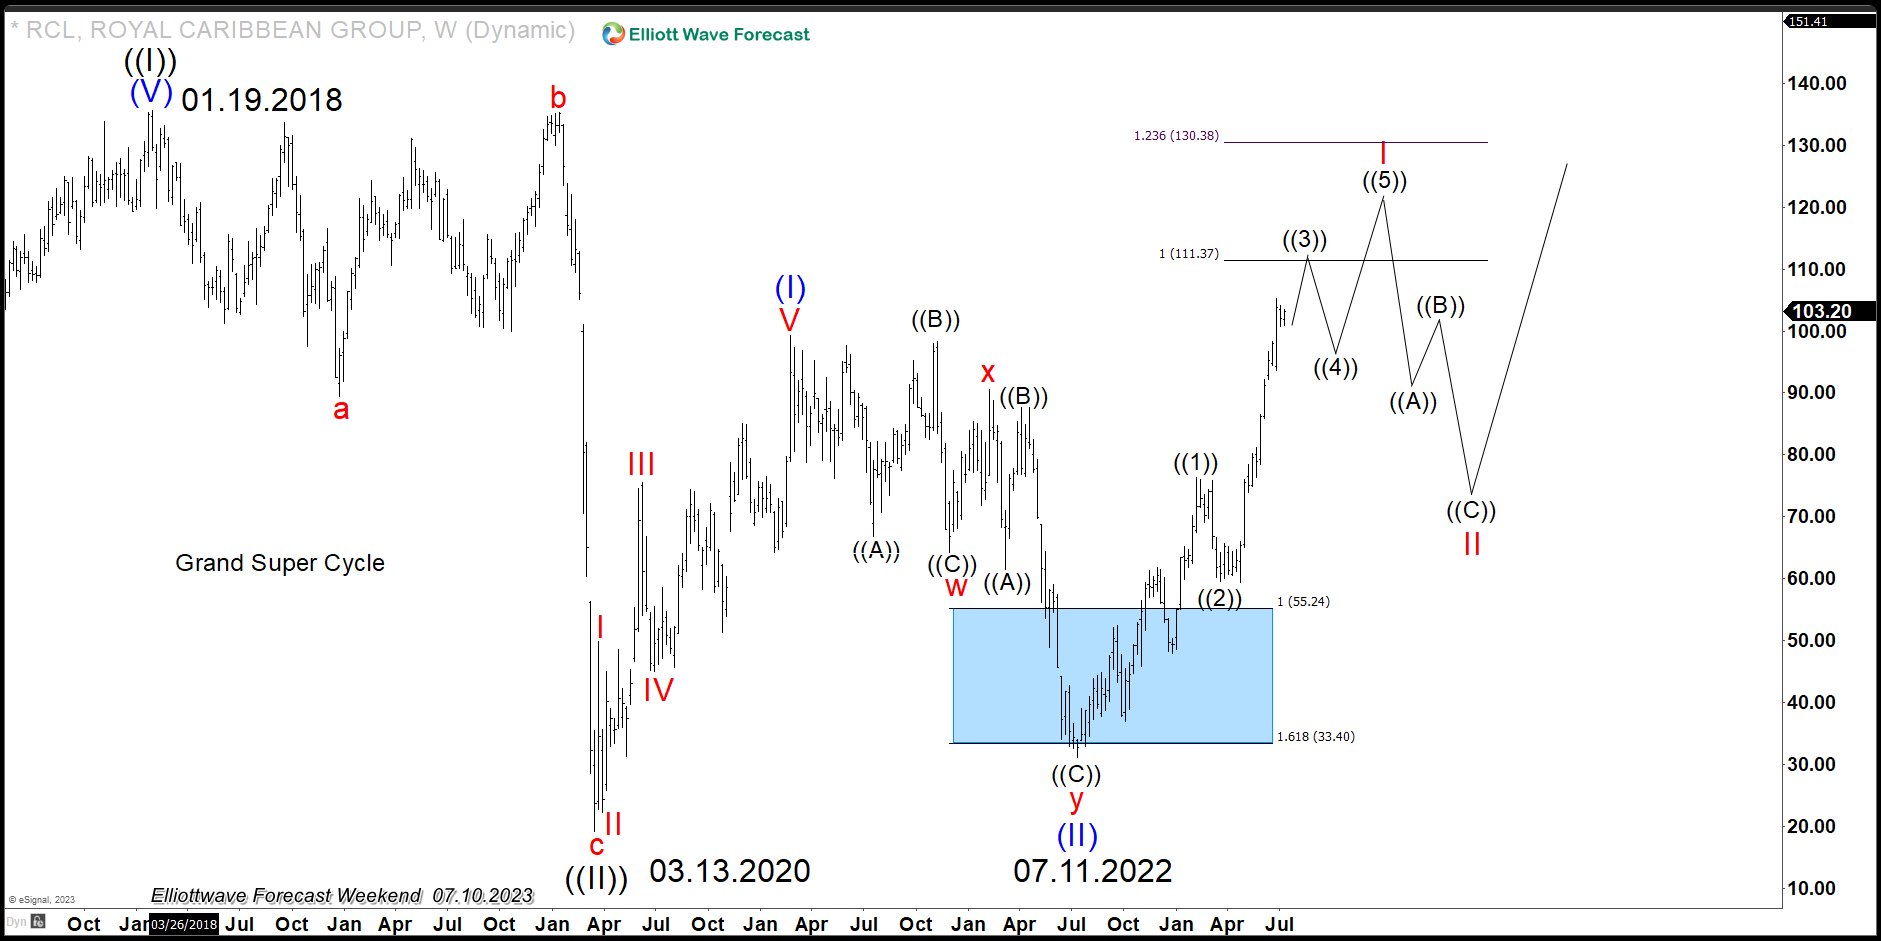
The chart above shows the expected pullback happens, and now a rally is underway. Target of the rally is $111.89-$130.90, which most likely will produce a three waves pullback. The Elliott Wave Theory states that the market corrects in three, seven, and eleven swing. As of now, as far as the stock stays below the peak on 01.19.2028, a seven swing lower still can't be ruled out. Using correlation with the other stock and market however, a double correction in 7 swing is less likely because symbols like $CCL ( Carnival Cruise Line) does not have the room for a massive sell-off. The sell off in RCL will likely come from the 111.89-130.90 area. Below we compare CCL and RCL technical chart
CCL and RCL Corrrelation Chart
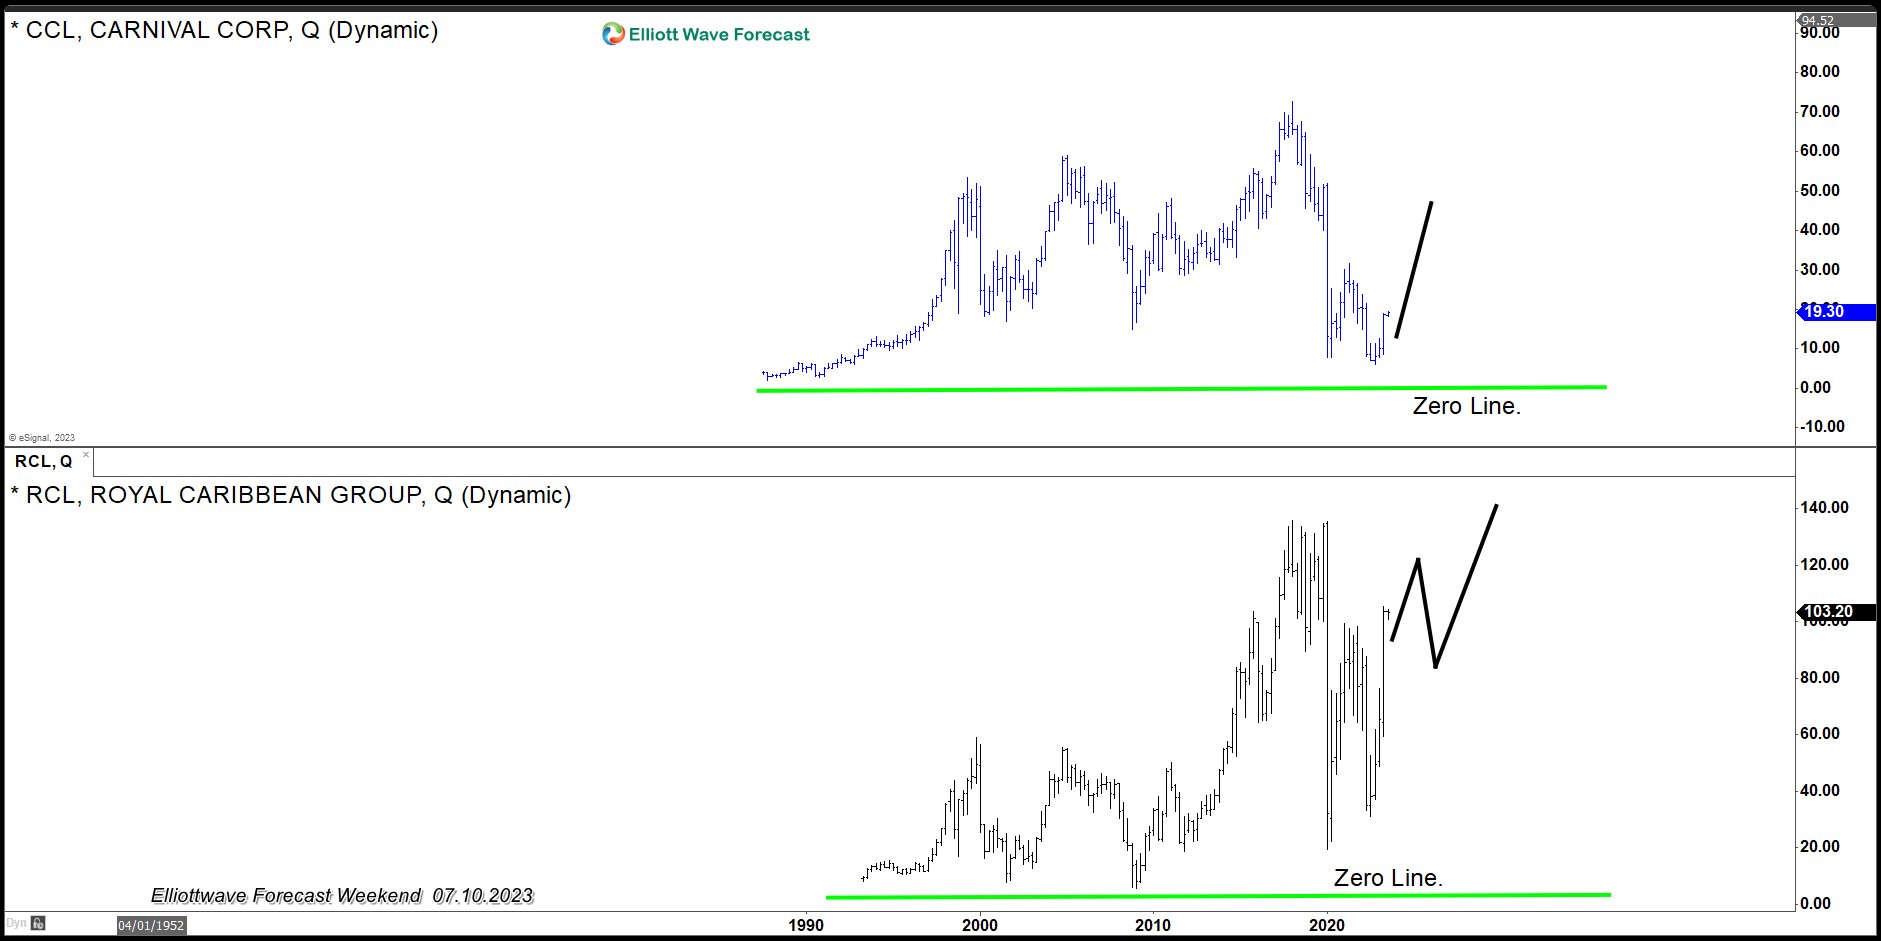
Above chart is an overlay of Royal Caribbean and Carnival Cruise Line, which shows how deep CCL pullback is compared to RCL within the Grand Super Cycle. CCL is near the zero line already and thus a huge stock selloff will take it out of business. The reality is that even when RCL can do a double correction in 7 swing lower, a major low is already in place, and the Grand Super Cycle Trend has renewed to the upside. There is no question a pullback should happen from the area, as mentioned earlier. Still, a pullback should give another opportunity to buy, allowing RCL to rally to new all-time highs.
면책 조항: 본 게시글에 표현된 견해는 전적으로 작성자의 견해이며 Followme의 공식 입장을 대변하지 않습니다. Followme는 제공된 정보의 정확성, 완전성 또는 신뢰성에 대해 책임을 지지 않으며, 서면으로 명시적으로 언급되지 않는 한 해당 내용을 기반으로 취해진 어떠한 조치에 대해서도 책임을 지지 않습니다.

더 오래된 의견은 없습니다. 소파를 가장 먼저 잡으십시오.