SoFi Technologies Inc. is an US American online personal finance company and online bank. It provides financial products including student and auto loan refinancing, mortgages, personal loans, credit card, investing, and banking through both mobile app and desktop interfaces. Founded 2011 and headquartered in San Francisco, California, US, it is a part of Russel 1000 small-cap index. Investors can trade it under the ticker $SOFI at NASDAQ.
SoFi Weekly Elliott Wave Analysis 06.10.2023
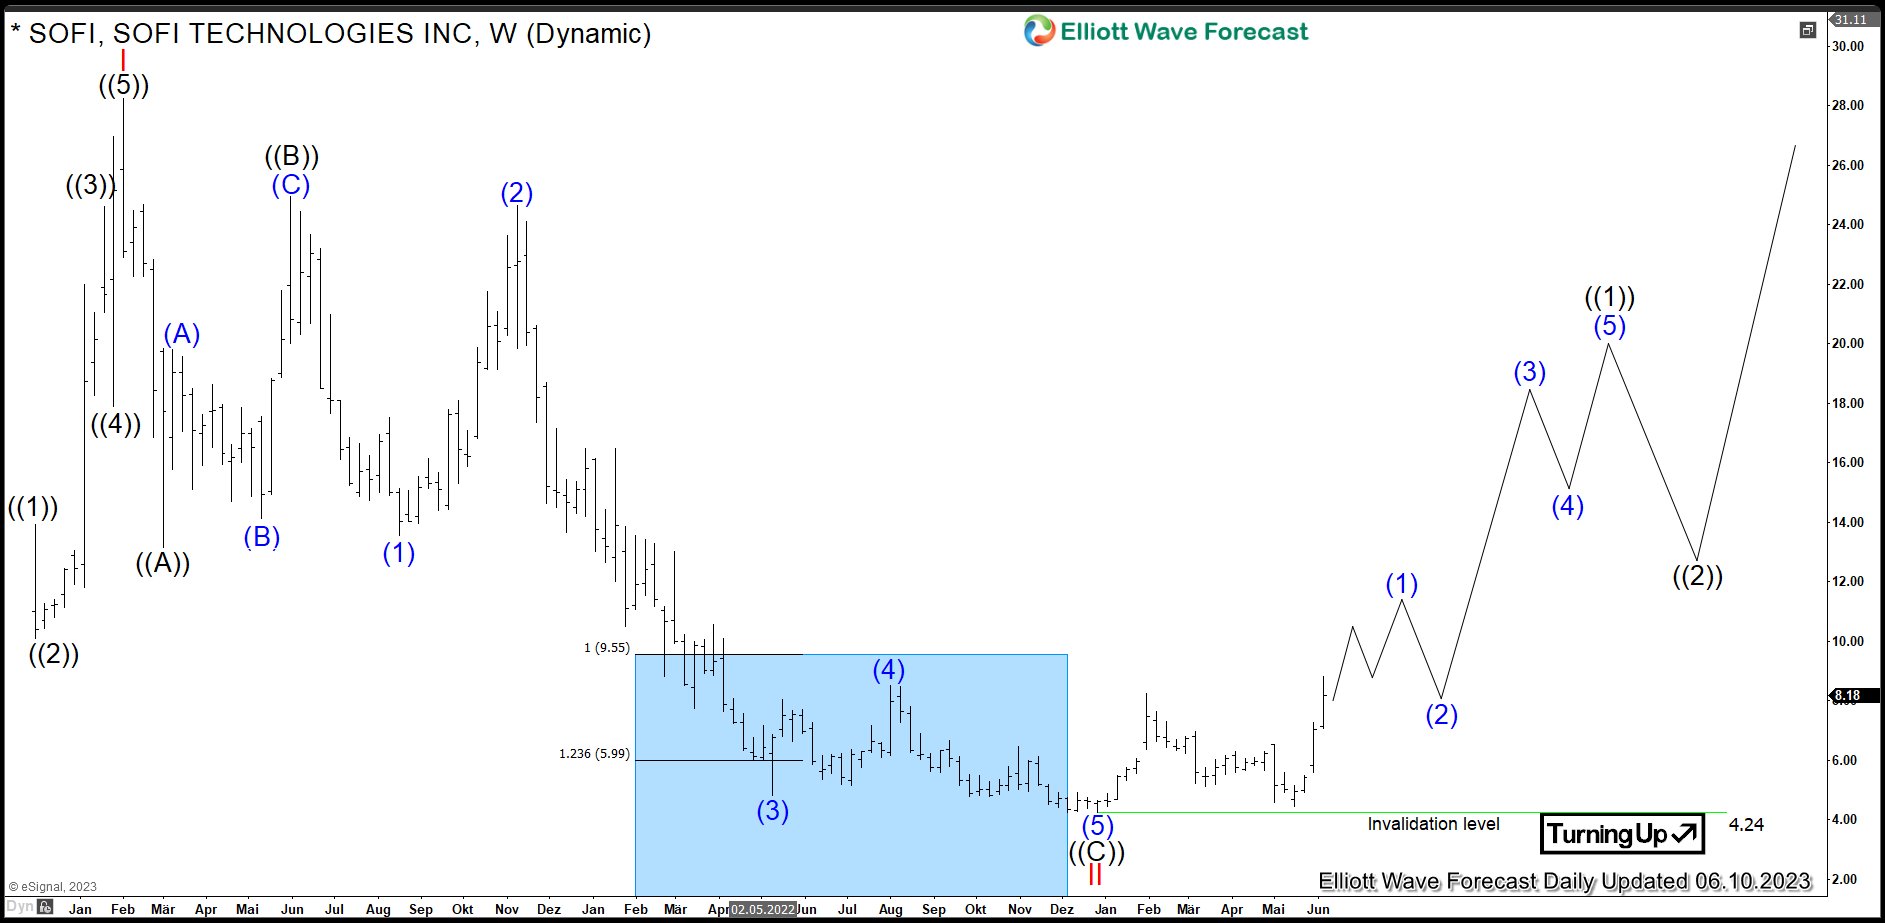
The weekly chart below shows the SoFi Technologies shares $SOFI traded at NASDAQ. From the all-time lows, the stock price has developed an initial cycle higher in red wave I of cycle degree towards $28.26 all-time highs in February 2021. Then, a correction lower in red wave II has unfolded as an Elliott wave zigzag pattern being 5-3-5 structure.
Firstly, 5 swings in black wave ((A)) of red wave II have printed a low at $13.14 in March 2021. Then, a bounce has set a connector wave ((B)) at $24.95 highs in May 2021. Later on, the price has broken 13.14 lows opening up a bearish sequence. As a consequence, target area for black wave ((C)) is towards 9.55-0.22 area. As a matter of fact, 5 waves of the the impulse in black wave ((C)) have reached already the 9.55-0.22 support area. It is the the preferred view that the correction has ended in December 2022 at $4.24 lows. While above there, a new bullish cycle in red wave III might have started. The target for the wave III is 32.48-49.94 area and even beyond.
SoFi 8 Hour Elliott Wave Analysis 06.10.2023
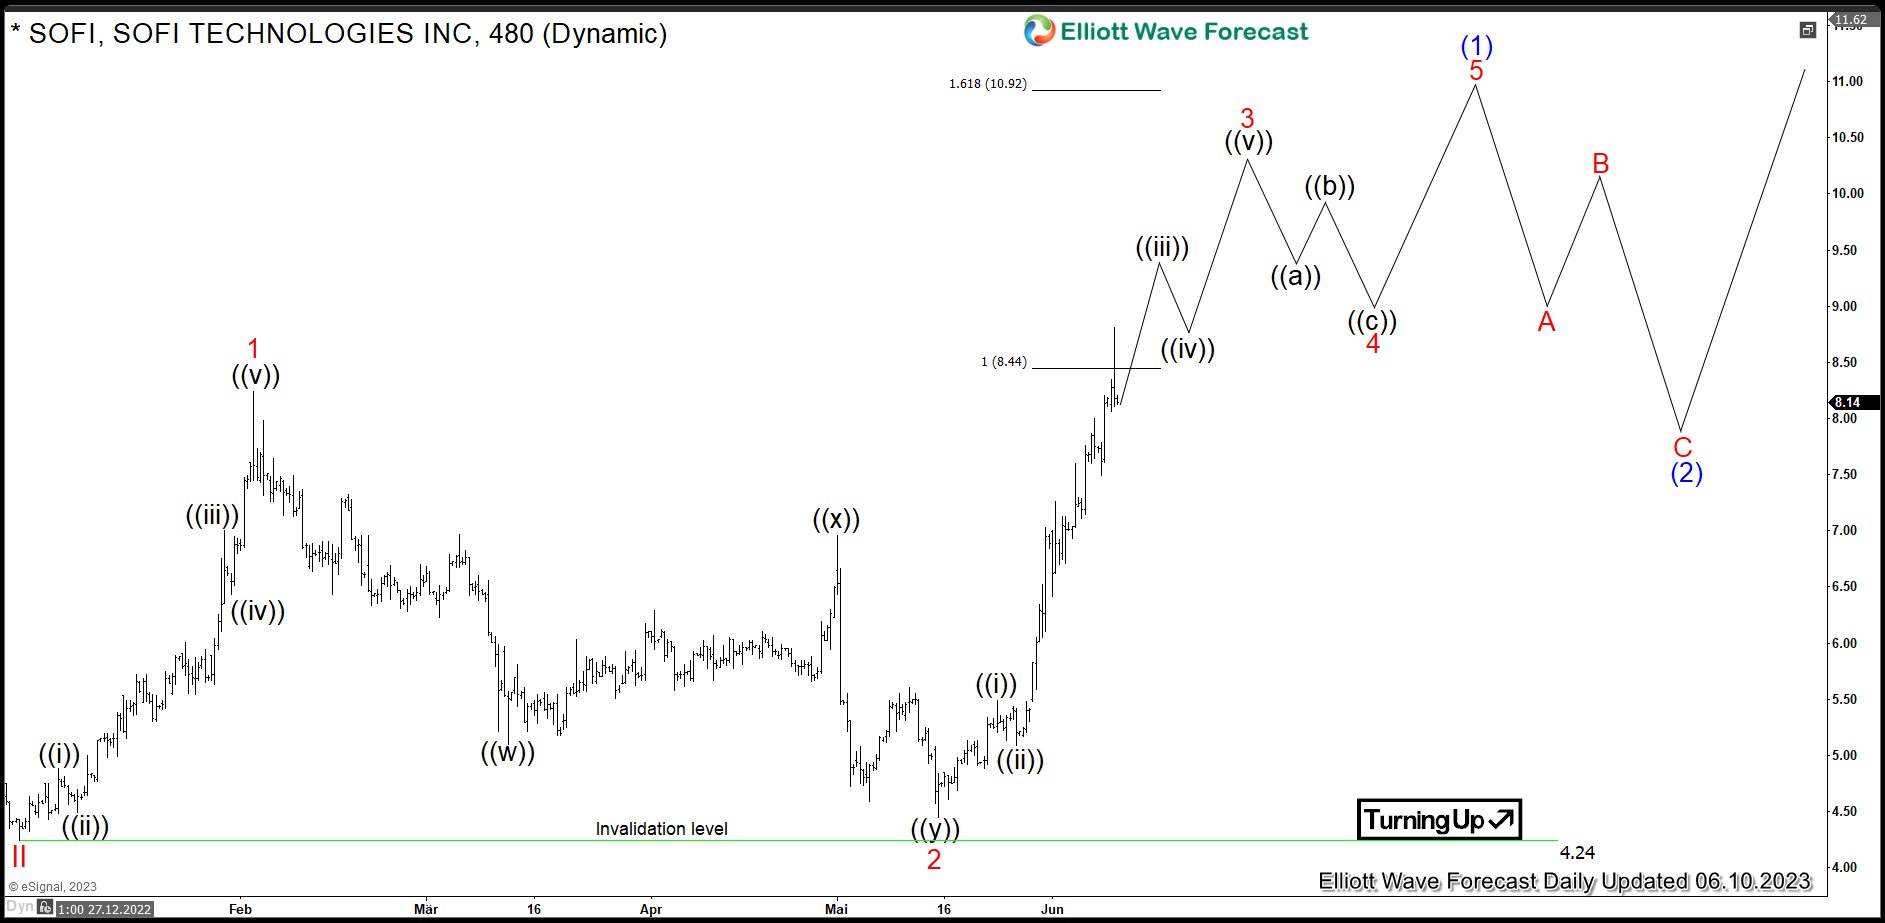
The 8 Hour chart below shows in more detail the initial stages of the red wave III. From the December 2022 lows at $4.24, blue wave (1) of black wave ((1)) of red wave III is unfolding as an impulse. Within it, first nest comprising red waves 1-2 has ended in May 2023. From 4.45 lows, red wave 3 is in progress. Even though it has reached the minimum target being 100% length of the wave 1, it can still extend within 8.44-10.92 area and even break beyond. Once finished, pullback in in red wave 4 should find support in 3, 7 swing for final push higher in red wave 5 to accomplish blue wave (1). Then, expect consolidation in blue wave (2) before acceleration higher in blue wave (3) can happen.
Investors should stay long $SoFi from 9.55-0.22 weekly support area. Traders can be waiting for blue wave (1) to end first and then buy dips in wave (2) in 3, 7 swings against 4.24 lows.
면책 조항: 본 게시글에 표현된 견해는 전적으로 작성자의 견해이며 Followme의 공식 입장을 대변하지 않습니다. Followme는 제공된 정보의 정확성, 완전성 또는 신뢰성에 대해 책임을 지지 않으며, 서면으로 명시적으로 언급되지 않는 한 해당 내용을 기반으로 취해진 어떠한 조치에 대해서도 책임을 지지 않습니다.

더 오래된 의견은 없습니다. 소파를 가장 먼저 잡으십시오.