The $USDX peaked back on 09.29.2022. Since then, the Index has been dropping. The Index is at risk of ending the cycle since the lows back in 2008. This means a huge selling could be happening now. We explained the idea in this article, published on 09.21.2022. We knew the $USDX was about to enter wave 4. At this stage, that's where we think the Index is. Wave four should still extend lower due to bearish sequence in pairs like the $USDSEK and $USDMXN. Both these pairs have not yet reached the target within their own sequence. The $USDMXN peaked on 04.2020. Since then, it has been doing an ABC lower. It already erased the divergence between A and C, but it has not yet reached the ideal Blue Box target.
Monthly USDMXN Elliott Wave Chart
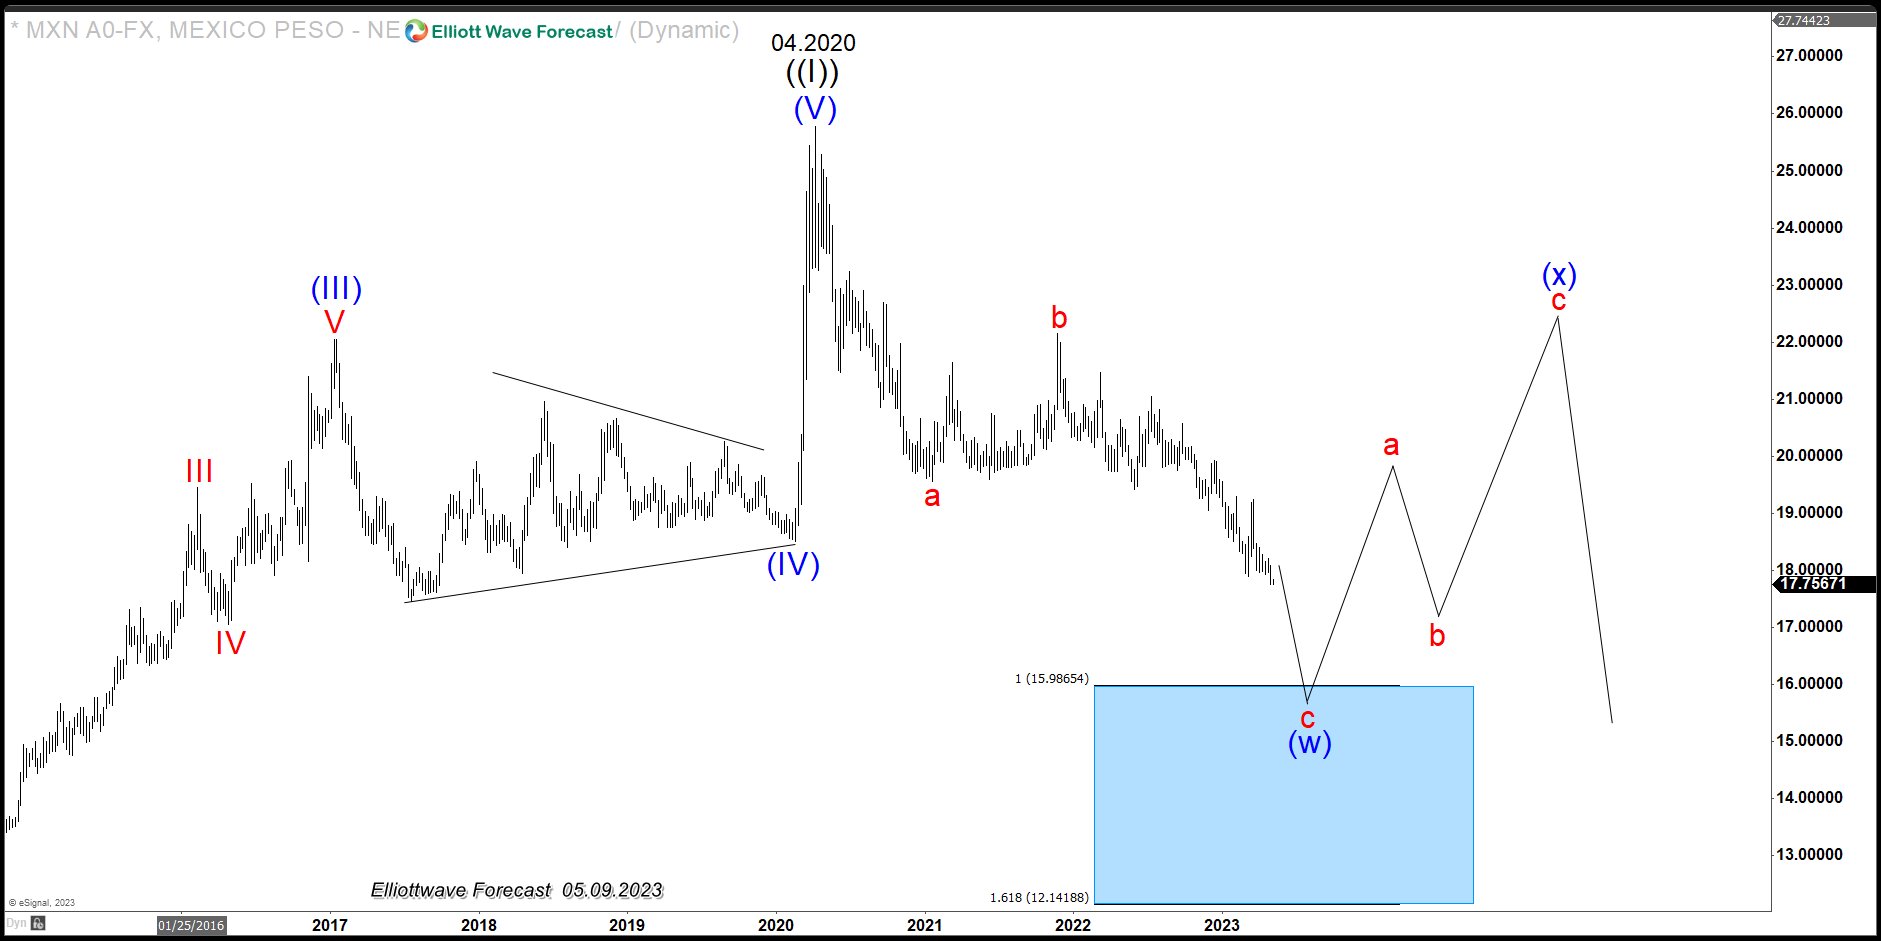
The chart above shows the monthly view of the $USDMXN and the blue box target where buyers should enter the market. The $USDSEK also shows a bearish sequence from the peak on 09.28.2022. It shows two channels, and the second one comes with momentum divergences. The decline from the peak has a corrective structure, which we labeled as WXY. Now we are entering wave Y leg, which should also reach the extreme. We expect both pairs to trade lower. If that is the case, $USDX should be weak consequently.
Daily $USDSEK Elliott Wave Chart
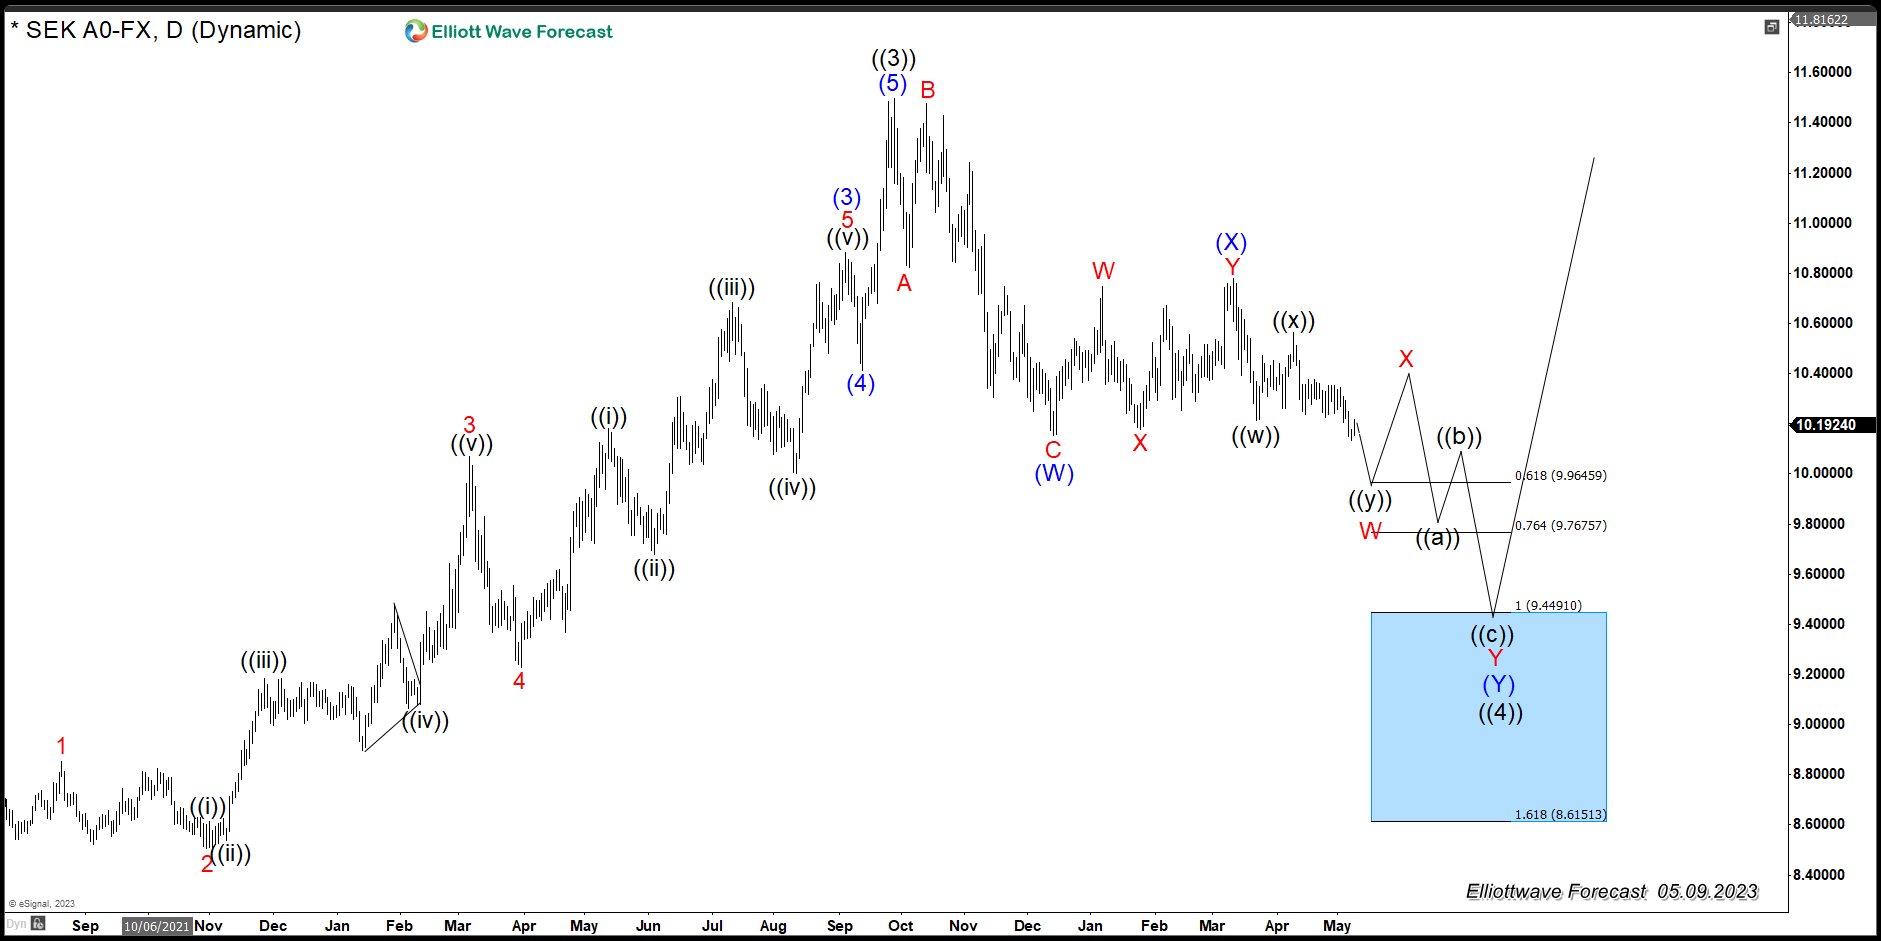
The chart above shows the $USDSEK Daily view and how the pair should move. The divergence between wave (W) and (Y) needs to be erased by the time we reach the blue box target.
면책 조항: 본 게시글에 표현된 견해는 전적으로 작성자의 견해이며 Followme의 공식 입장을 대변하지 않습니다. Followme는 제공된 정보의 정확성, 완전성 또는 신뢰성에 대해 책임을 지지 않으며, 서면으로 명시적으로 언급되지 않는 한 해당 내용을 기반으로 취해진 어떠한 조치에 대해서도 책임을 지지 않습니다.

더 오래된 의견은 없습니다. 소파를 가장 먼저 잡으십시오.