Procter & Gamble Co (NYSE: PG), a household name in consumer goods, has been a staple in many homes for generations. From Crest toothpaste to Tide laundry detergent, P&G's products are ubiquitous and trusted by millions. But as the company faces increasing competition and changing consumer preferences, can it continue to deliver for its investors? This article dives into the Elliott Wave analysis of P&G, revealing potential bullish patterns that may excite both long-term investors and short-term traders. Let's take a closer look at what the future may hold for this iconic company.
PG Daily Elliott Wave Chart
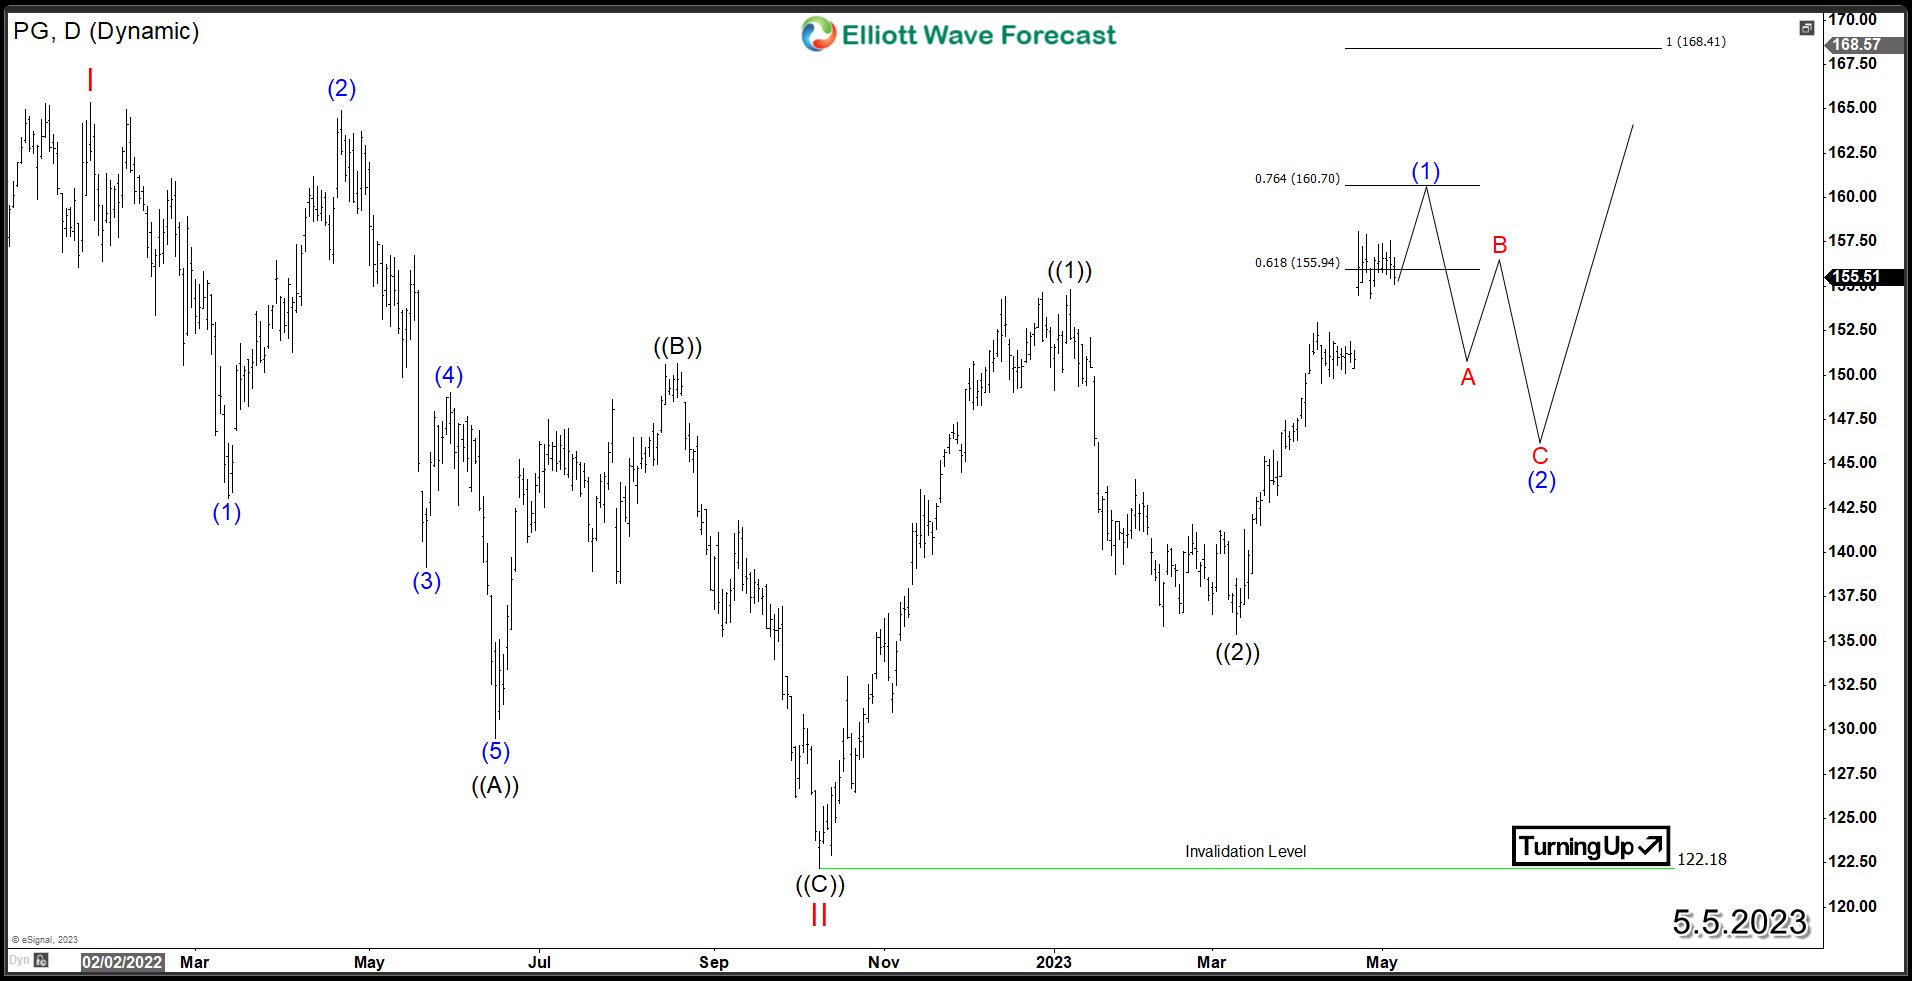
PG experienced a decline in 2022, which is believed to be a wave II correction that concluded at $122.18 in October of that year. After the correction, PG rallied higher in wave ((1)), followed by a correction in wave ((2)) before starting another cycle higher in wave ((3)). Recently, the stock broke above January 2023 peak creating a bullish sequence of 2022 low and supporting the stock toward weekly target at $168. However, the daily cycle has reached an extreme area at 155.9 - 160.7, which could create a 3 waves pullback to correct the rally since March 2023 low. This correction lower could present a daily buying opportunity as long as it remains above $135.38 low. Investors can look for continuation towards a new all-time high from there.
면책 조항: 본 게시글에 표현된 견해는 전적으로 작성자의 견해이며 Followme의 공식 입장을 대변하지 않습니다. Followme는 제공된 정보의 정확성, 완전성 또는 신뢰성에 대해 책임을 지지 않으며, 서면으로 명시적으로 언급되지 않는 한 해당 내용을 기반으로 취해진 어떠한 조치에 대해서도 책임을 지지 않습니다.

더 오래된 의견은 없습니다. 소파를 가장 먼저 잡으십시오.