In this technical blog, we will look at the past performance of the 4-hour Elliott Wave Charts of Apple ticker symbol: AAPL. We presented to members at the elliottwave-forecast. In which, the rally from 03 January 2023 low unfolded as an impulse structure suggesting that it's a motive sequence & pullback should find support in 3, 7 or 11 swings for another extension higher at least. Therefore, we advised members not to sell the stock & buy the dips in 3, 7, or 11 swings based on the Elliott wave hedging tool looking for a minimum reaction higher to take place. We will explain the structure & forecast below:
AAPL 4-Hour Elliott Wave Chart From 2.26.2023
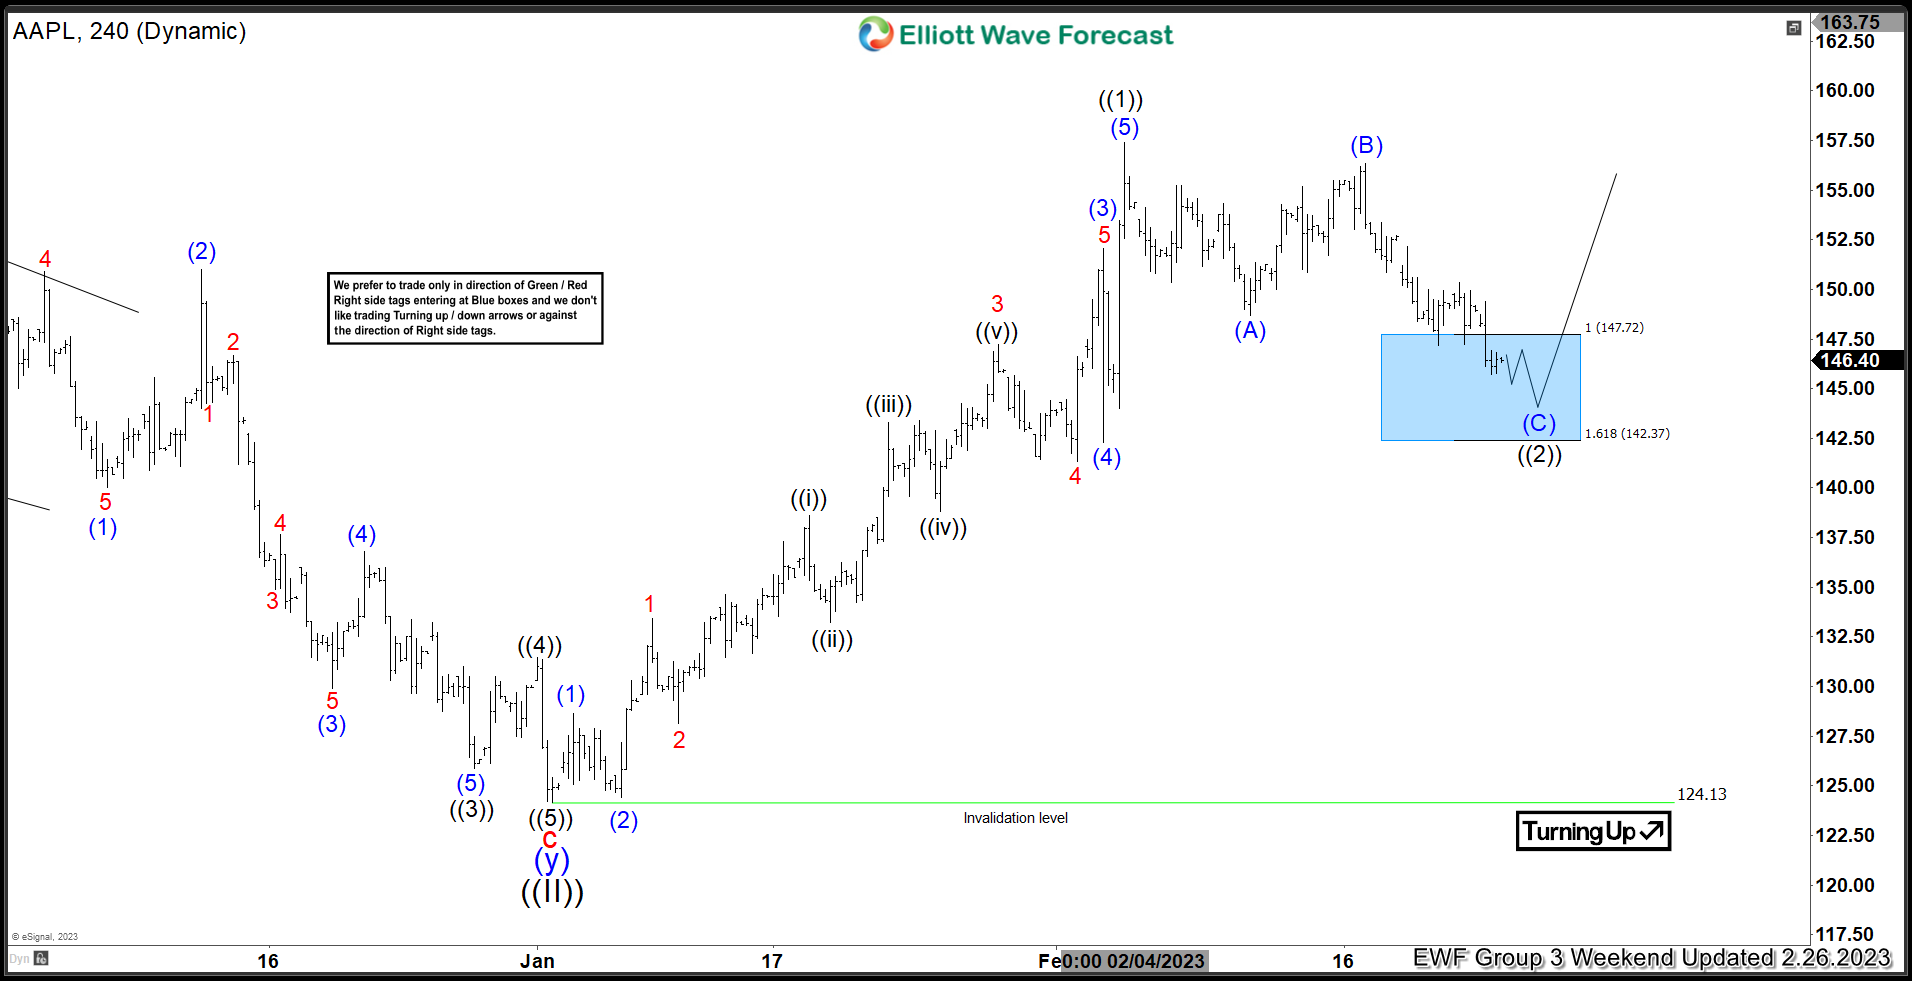
Here’s 4 hr Elliott wave chart from the 2/26/2023 update. In which, the cycle from the 1/03/2023 low ended in wave ((1)) as an impulse structure at $157.38 high. Down from there, the stock made a pullback in wave ((2)) to correct that cycle. The internals of that pullback unfolded as Elliott wave zigzag structure where wave (A) ended at $148.70 low. Wave (B) ended at $156.33 high and wave (C) managed to reach the blue box area at $147.72- $142.37 area. From there, buyers were expected to appear looking for the next leg higher or for a 3-wave bounce minimum.
AAPL Latest 4-Hour Elliott Wave Chart From 3.07.2023

This is the latest 4 hr Elliott wave Chart from the 3/07/2023 update. In which the stock is showing a strong reaction higher taking place, right after ending the zigzag correction within the blue box area. Allowed members to create a risk-free position shortly after taking the long position at the blue box area. However, a break above $157.38 high would still be needed to confirm the next extension higher & avoid a double correction lower.
면책 조항: 본 게시글에 표현된 견해는 전적으로 작성자의 견해이며 Followme의 공식 입장을 대변하지 않습니다. Followme는 제공된 정보의 정확성, 완전성 또는 신뢰성에 대해 책임을 지지 않으며, 서면으로 명시적으로 언급되지 않는 한 해당 내용을 기반으로 취해진 어떠한 조치에 대해서도 책임을 지지 않습니다.

더 오래된 의견은 없습니다. 소파를 가장 먼저 잡으십시오.