· Views 2,409
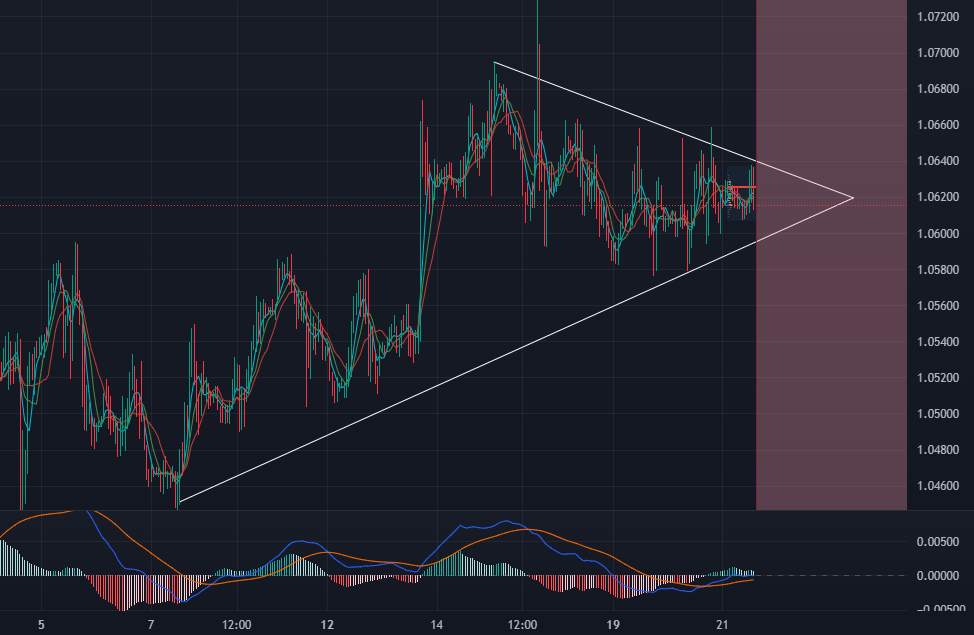
EUR vs USD created ascending triangle pattern in H1 timeframe. But we need compare it with the bigger timeframes also. In H4, EURUSD wanna break trendline and want to go downside. In Daily timeframe , it show us strong level between 1.0636 and 1.0776.
Now, what will think for further analysis? Let's research now.
Strong pattern is ascending triangle . It supports by breaking trend line in H4 also. This situation is a simple reminder for jumping up. But we should remember that EURUSD is high volatile pair and any fundamental or technical news can affect it positively or negatively.
In my opinion:
EURUSD will break trendline in H4, follow strong barrier in Daily timeframe . We can put:
SELL LIMIT at 1.0733
TARGET 1.0405
STOP LOSS 1.0805
or
SELL STOP at 1.0560
TARGET 1.0405
STOP LOSS 1.0743
These are only forecast. Do not forget to use SL in own trading. Trading without stop loss and bigger lots can cause heavy losses.
Good luck!
면책 조항: 본 게시글에 표현된 견해는 전적으로 작성자의 견해이며 Followme의 공식 입장을 대변하지 않습니다. Followme는 제공된 정보의 정확성, 완전성 또는 신뢰성에 대해 책임을 지지 않으며, 서면으로 명시적으로 언급되지 않는 한 해당 내용을 기반으로 취해진 어떠한 조치에 대해서도 책임을 지지 않습니다.
이 글이 마음에 드시나요? 작성자에게 팁을 보내 감사의 마음을 전하세요.

더 오래된 의견은 없습니다. 소파를 가장 먼저 잡으십시오.