· Views 2,470
We used the theory of price action in order to conduct this analysis, so that we could guide our decision-making process.
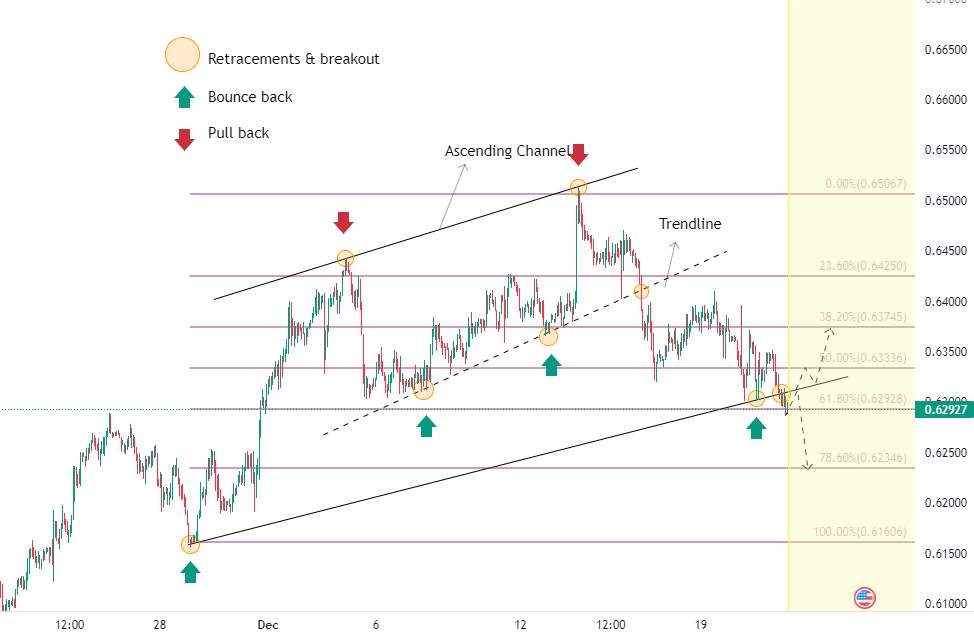
Based on the results of this analysis, we can see that the price is moving upwards while using the ascending channel to do so. In the past several months, the price has given us numerous pullbacks and bounce backs. In addition, the price has also tested the inner trend line in an attempt to complete the uptrend. However, near 0.64096, the price finally broke the inner trend line , giving us a short-term retracement, which gave us a new short-term downtrend. For more accuracy, we use Fibonacci levels. As of today, the price has already broken through the ascending channel and has held the support level of 0.62928 (61.80% of the Fibo). In the following days, we will be able to target the area where we can trade.
1.In the case of a price support moving down, the price is likely to move down and test the next support near 0.62928. If this support is broken, the price will enter a trend.
2.The target area near 0.63336 and 0.63745 is a retracement from the support area and a retest of the channel line; then price closes within the channel.
With this analysis, you will be able to find your most profitable trade, since Enclavefx believes in enhancing the knowledge of our clients & followers.
면책 조항: 본 게시글에 표현된 견해는 전적으로 작성자의 견해이며 Followme의 공식 입장을 대변하지 않습니다. Followme는 제공된 정보의 정확성, 완전성 또는 신뢰성에 대해 책임을 지지 않으며, 서면으로 명시적으로 언급되지 않는 한 해당 내용을 기반으로 취해진 어떠한 조치에 대해서도 책임을 지지 않습니다.
이 글이 마음에 드시나요? 작성자에게 팁을 보내 감사의 마음을 전하세요.

더 오래된 의견은 없습니다. 소파를 가장 먼저 잡으십시오.