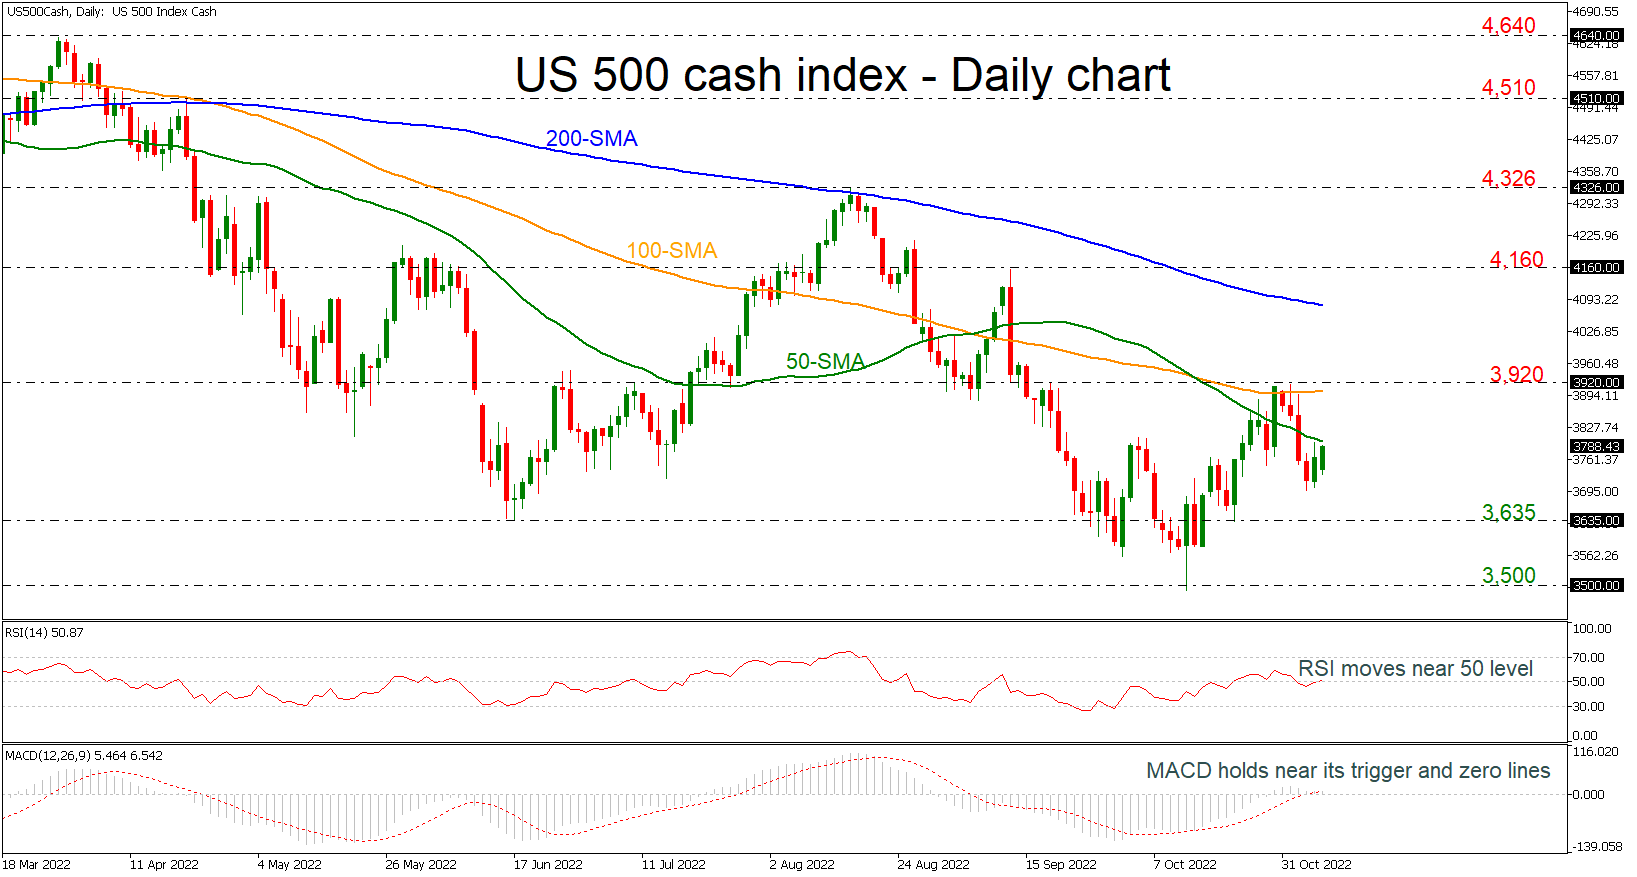
The US 500 stock index is moving slightly higher, approaching the 50-day simple moving average (SMA), holding well above the crucial 200-weekly SMA, which is acting as strong support level near 3,635. The RSI indicator is pointing slightly up near the neutral threshold of 50, while the MACD is moving sideways near its trigger and zero lines.
If price action jumps above the 50-day SMA (immediate resistance), there is scope to test the 100-day SMA around the 3,920 barrier. Clearing this key level would see additional gains towards the 200-day SMA at 4,080.
If the 3,635 support fails, then the focus would shift to the downside towards 3,500, which if breached would increase downside pressure and bring about a reversal of the trend. From here, the index would be on the path towards the 3,233 barrier, registered in October 2020.
Overall, the US 500 index has been negative in the long-term timeframe and only a climb above the 200-day SMA may change the outlook to bullish.
면책 조항: 본 게시글에 표현된 견해는 전적으로 작성자의 견해이며 Followme의 공식 입장을 대변하지 않습니다. Followme는 제공된 정보의 정확성, 완전성 또는 신뢰성에 대해 책임을 지지 않으며, 서면으로 명시적으로 언급되지 않는 한 해당 내용을 기반으로 취해진 어떠한 조치에 대해서도 책임을 지지 않습니다.

더 오래된 의견은 없습니다. 소파를 가장 먼저 잡으십시오.