Key Highlights
- GBP/USD gained pace and tested the 1.1650 zone.
- It broke a major bearish trend line with resistance near 1.1400 on the 4-hours chart.
- EUR/USD corrected gains from 1.0090 and might find bids near 0.9820.
- The US ISM Manufacturing Index could decline from 50.9 to 50.0 in Oct 2022.
GBP/USD Technical Analysis
The British Pound gains pace after it broke the 1.1400 resistance against the US Dollar. GBP/USD even cleared the 1.1500 zone to move into a positive zone.
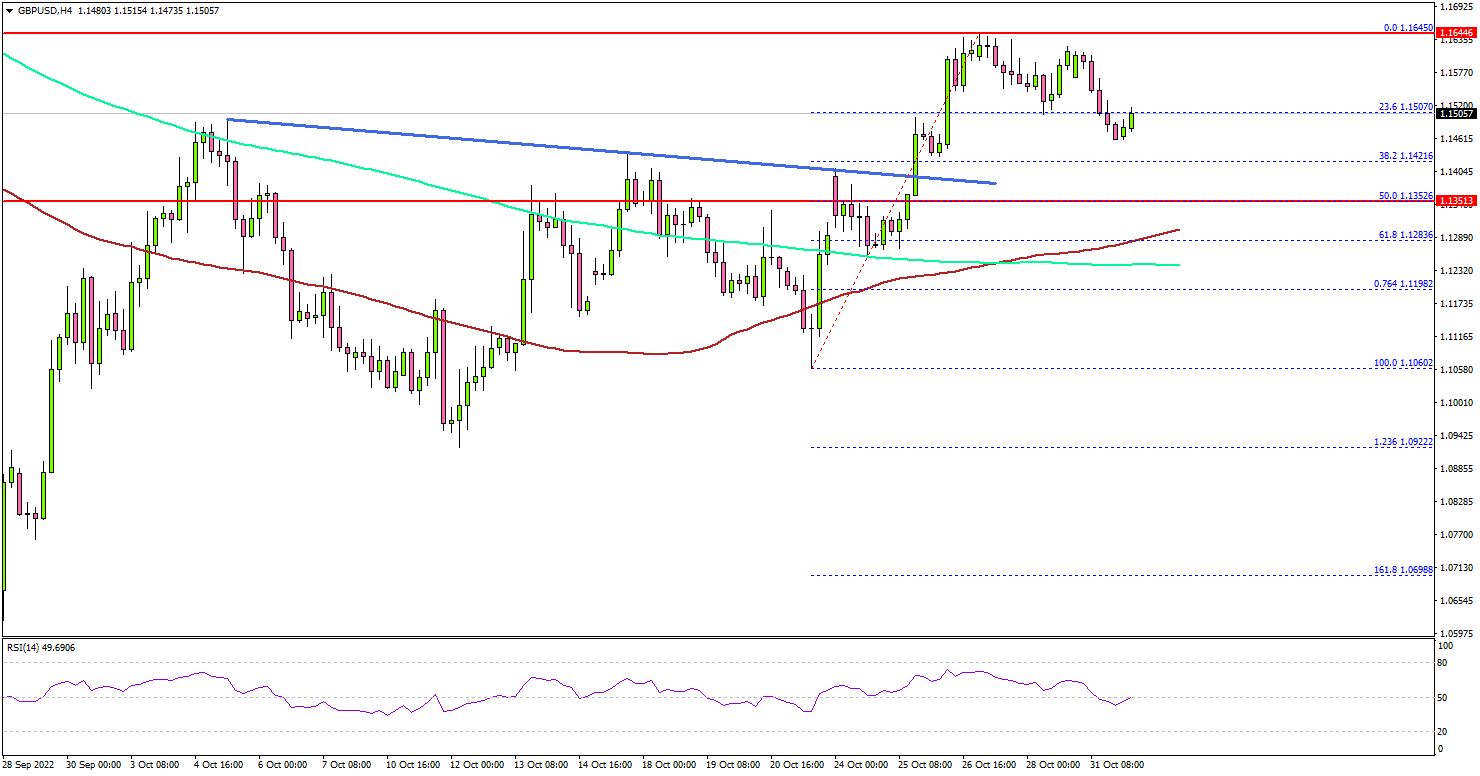
Looking at the 4-hours chart, the pair climbed above the 1.1550 level. There was also a close above the 100 simple moving average (red, 4-hours) plus the 200 simple moving average (green, 4-hours).
A high was formed near 1.1645 before there was a downside correction. The pair declined below the 1.1600 and 1.1585 support levels. The bears pushed the pair below the 23.6% Fib retracement level of the upward move from the 1.1060 swing low to 1.1645 high.
An initial support is near the 1.1425 level. The next major support is near the 1.1350 zone. It is near the 50% Fib retracement level of the upward move from the 1.1060 swing low to 1.1645 high.
The main support sits at 1.1280 and the 100 simple moving average (red, 4-hours). A downside break below the 1.1380 zone could push the pair into a bearish zone. In the stated case, it could decline towards the 1.1200 support.
On the upside, GBP/USD is facing a major resistance near the 1.1600 zone. The next major resistance may perhaps be near 1.1650. Any more gains could set the pace for a move towards the 1.1800 level, above which it could even test 1.2000.
Looking at EUR/USD, the pair topped near the 1.0093 level and recently started a downside correction below the 1.0000 level.
Economic Releases
- US ISM Manufacturing Index for Oct 2022 – Forecast 50.0, versus 50.9 previous.
면책 조항: 본 게시글에 표현된 견해는 전적으로 작성자의 견해이며 Followme의 공식 입장을 대변하지 않습니다. Followme는 제공된 정보의 정확성, 완전성 또는 신뢰성에 대해 책임을 지지 않으며, 서면으로 명시적으로 언급되지 않는 한 해당 내용을 기반으로 취해진 어떠한 조치에 대해서도 책임을 지지 않습니다.

더 오래된 의견은 없습니다. 소파를 가장 먼저 잡으십시오.