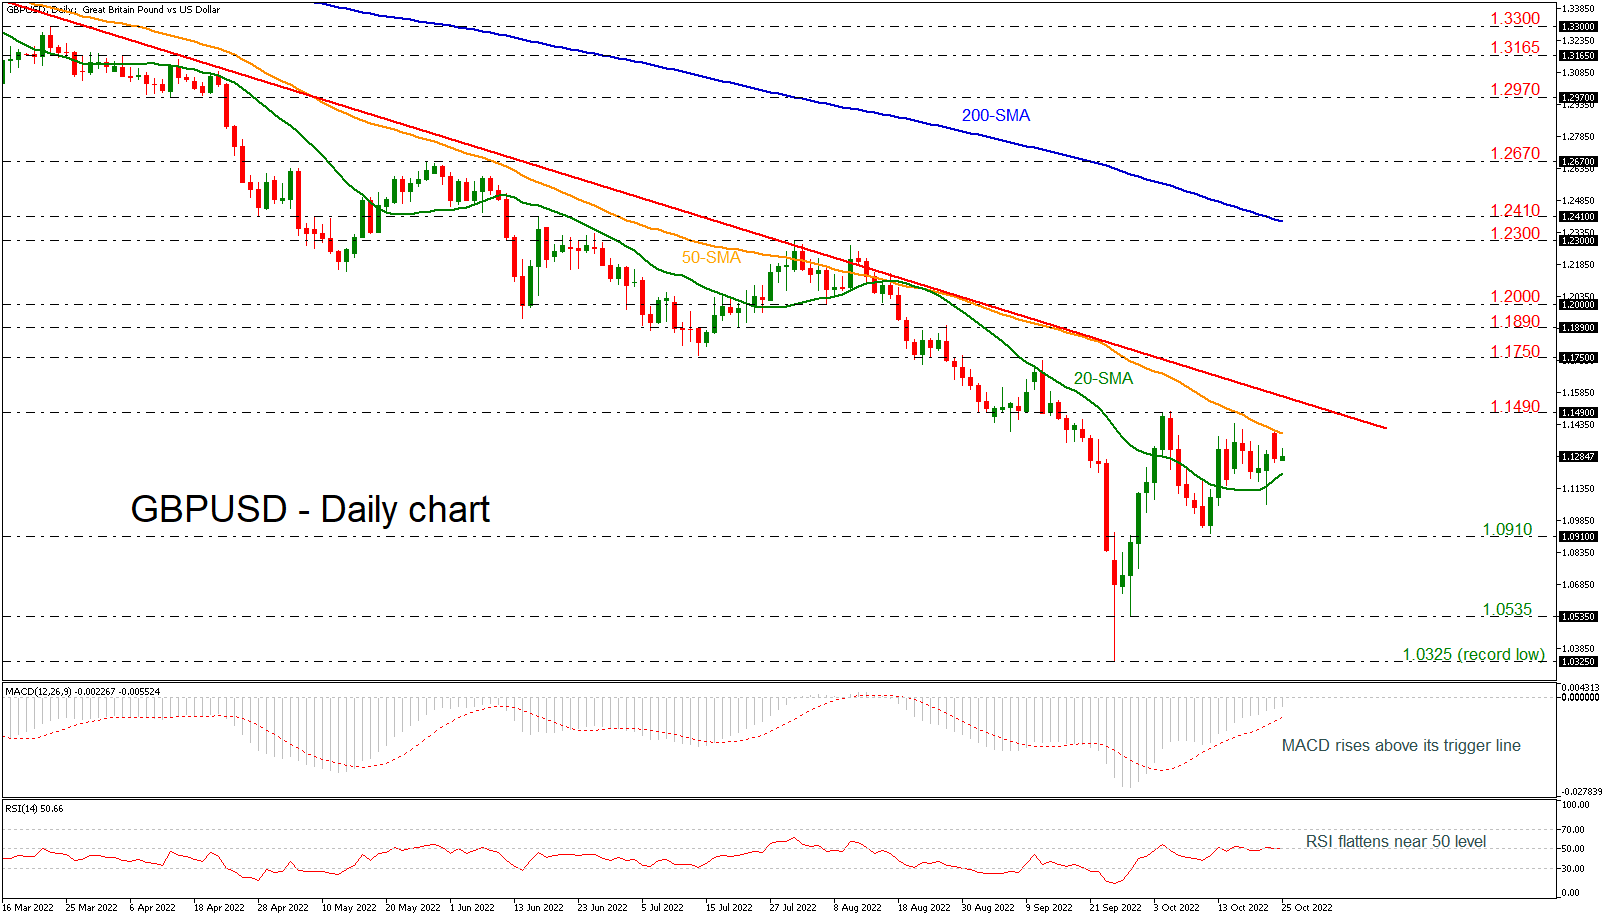
GBPUSD is hovering within the 20- and 50-day simple moving averages (SMAs) after the bearish movement from the 1.1400 mark on Monday. In the short-term, the price is failing to endorse a bullish correction and is shifting the bias to neutral.
Technically, the MACD oscillator is still strengthening its positive momentum, while the RSI is moving sideways near the neutral threshold of 50.
Should prices reverse lower, immediate support could come from the 20-day SMA at 1.1205. Below that, the 1.0910 barrier is another major support ahead of the 1.0535 level. Further losses would open the way towards the record low of 1.0325.
In the event of an upside reversal, the 50-day SMA at 1.1400 could act as a barrier before being able to re-challenge the 1.1490 resistance level. A break above this line would test the long-term downtrend line around 1.1550. Further gains would lead the way to a more bullish outlook in the near-term meeting the next resistance levels such as 1.1750 and 1.1890.
In the bigger picture, the pair is bearish as long as it holds below the 200-day SMA and the falling trend line. In case it violates these lines, bulls could take the upper hand.
면책 조항: 본 게시글에 표현된 견해는 전적으로 작성자의 견해이며 Followme의 공식 입장을 대변하지 않습니다. Followme는 제공된 정보의 정확성, 완전성 또는 신뢰성에 대해 책임을 지지 않으며, 서면으로 명시적으로 언급되지 않는 한 해당 내용을 기반으로 취해진 어떠한 조치에 대해서도 책임을 지지 않습니다.

더 오래된 의견은 없습니다. 소파를 가장 먼저 잡으십시오.