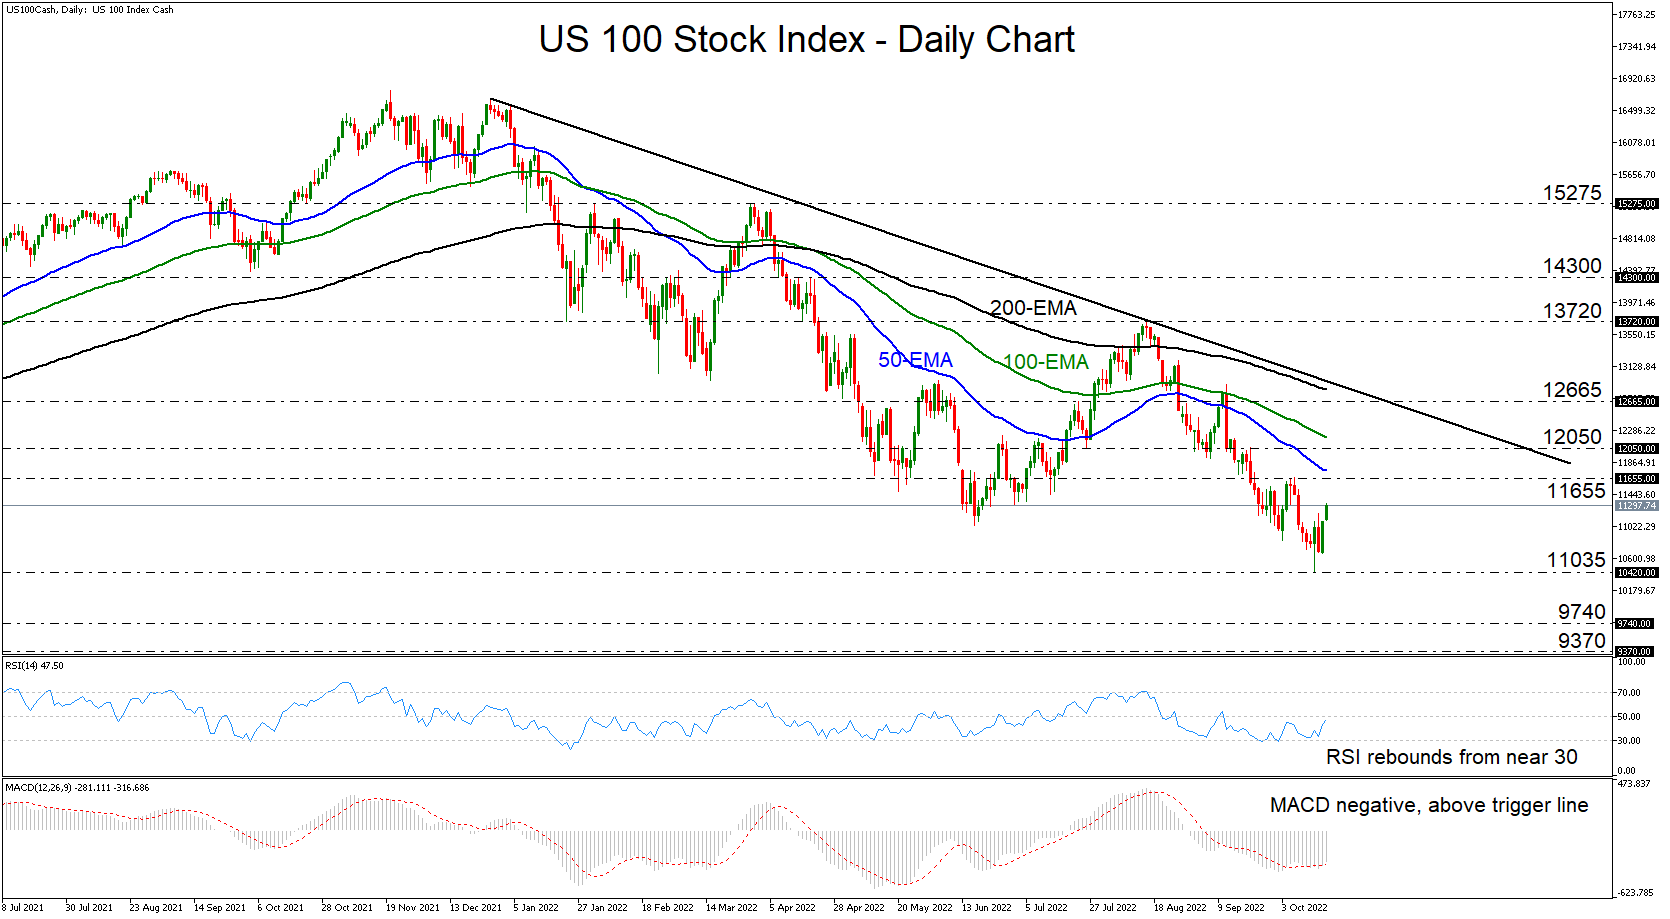
The US 100 cash index rebounded from 11035 last Thursday, with the recovery accelerating this week. That said, the index remains well below the downside resistance line drawn from the high of December 28, as well as below all the plotted exponential moving averages, which keeps the broader outlook negative.
The RSI and the MACD point to weakening downside momentum, which means that some further recovery may be on the cards before the bears take the upper hand again. The former rebounded from near 30 and is now approaching its 50 line, while the latter is lying within its negative territory, but above its trigger line, pointing up.
The bears could regain control from near the high of October 6 at 11655, or even from slightly higher, near the 12050 zone. If so, they could dive all the way down for another test at around 11035, the break of which would confirm, not only a lower low, but a new 28-month low as well. The next zones to consider as potential support areas may be at around 9740 and 9370, marked by the lows of June 29 and 15 respectively.
On the upside, a break above 12665 may be needed before all the bulls get off their couch. This could confirm the breach of the aforementioned downside line and may see scope for advances all the way up to the 13720 barrier, marked by the high of August 16. If investors are not willing to stop there, then we may see them shooting for the 14300 area, marked by the highs of April 20 and 21.
Recapping, US 100 has been in a recovery mode lately, but the bigger picture still points to a downtrend. Therefore, even if there are some more advances in store, the bears could very well recharge soon and aim for a new 28-month low.
면책 조항: 본 게시글에 표현된 견해는 전적으로 작성자의 견해이며 Followme의 공식 입장을 대변하지 않습니다. Followme는 제공된 정보의 정확성, 완전성 또는 신뢰성에 대해 책임을 지지 않으며, 서면으로 명시적으로 언급되지 않는 한 해당 내용을 기반으로 취해진 어떠한 조치에 대해서도 책임을 지지 않습니다.

더 오래된 의견은 없습니다. 소파를 가장 먼저 잡으십시오.