· Views 759
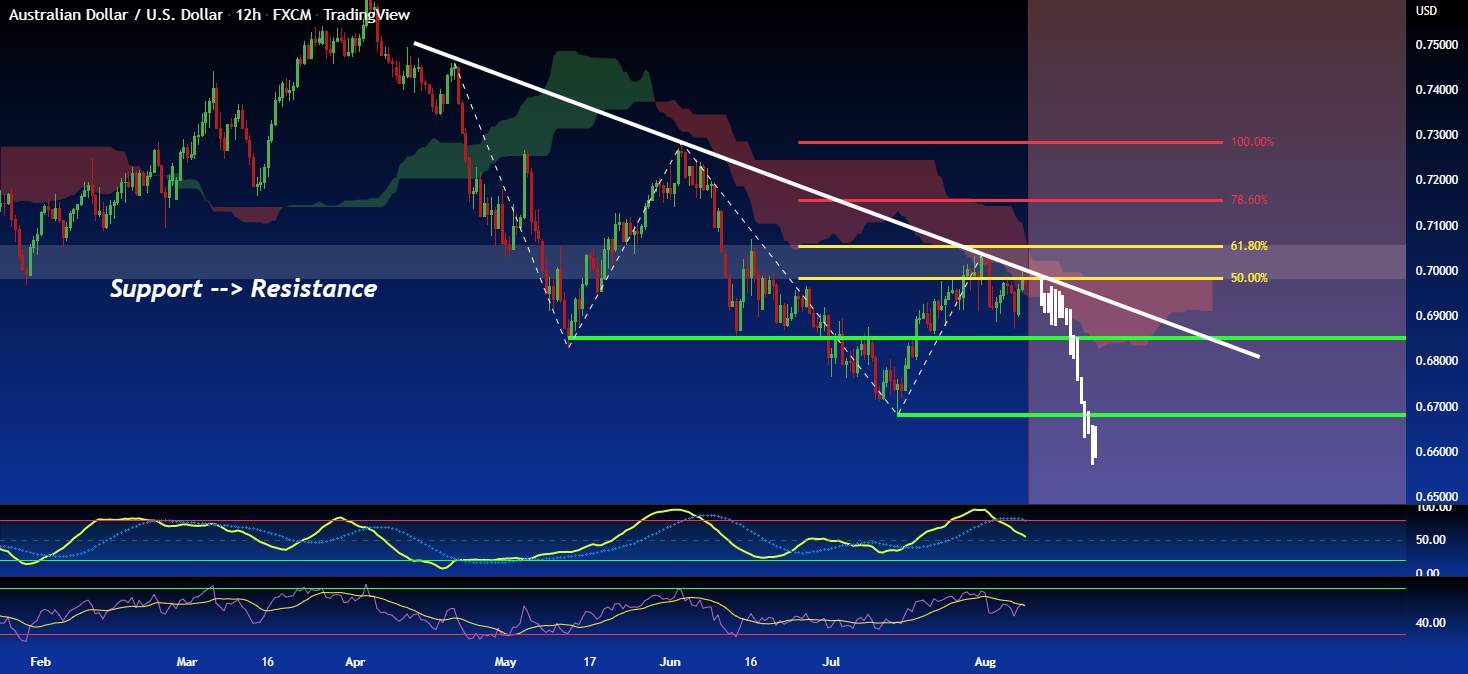
AUD/USD The Ichimoku forecast shows us a Bearish trend and that can be noticed from the Higher and lowers become lower at any swing, I drew a dashed line works to show you how this happens. Now the price technically it's inside a retracement from the Bearish trend with a Bullish impulse that touches the 50% Fibo area with the confluence of support becomes resistance Area of price around 0.7000 and 0.7050. The value of the Stochastic indicator is dropped from the overbought situation and the RSI is turned bearish. #OPINIONLEADER#
면책 조항: 본 게시글에 표현된 견해는 전적으로 작성자의 견해이며 Followme의 공식 입장을 대변하지 않습니다. Followme는 제공된 정보의 정확성, 완전성 또는 신뢰성에 대해 책임을 지지 않으며, 서면으로 명시적으로 언급되지 않는 한 해당 내용을 기반으로 취해진 어떠한 조치에 대해서도 책임을 지지 않습니다.
이 글이 마음에 드시나요? 작성자에게 팁을 보내 감사의 마음을 전하세요.

더 오래된 의견은 없습니다. 소파를 가장 먼저 잡으십시오.