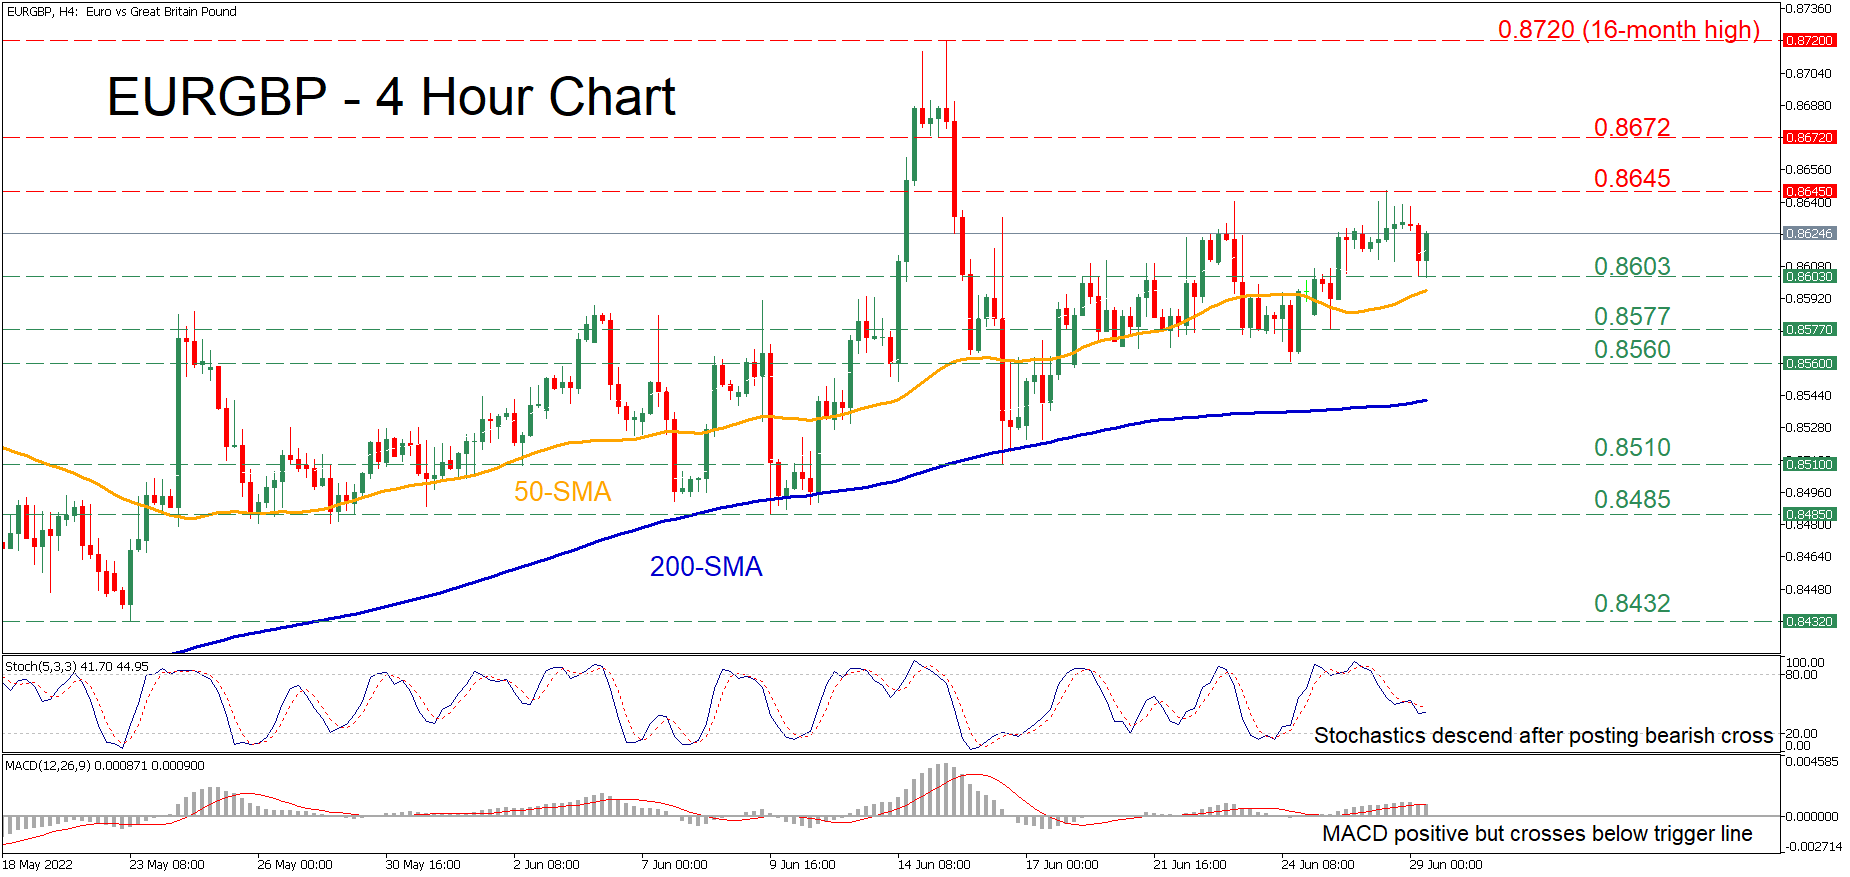
EURGBP has been marching higher since its downtrend ceased at the 0.8510 region, generating a profound structure of higher highs and higher lows. Nevertheless, in the last few four-hour sessions, the pair has been trading sideways after its upside move got capped at 0.8645.
The momentum indicators are reflecting a loss of momentum for the pair. The stochastic oscillator is descending after posting a bearish cross, while the MACD has dived beneath its red signal line but remains in the positive region.
Should selling pressure intensify, the price could test its most recent low of 0.8603. Dipping beneath that region, the bears could aim for 0.8577 before the spotlight turns to the 0.8560 barrier. Failing to halt there, 0.8510 could prove a tough obstacle for the price to overcome.
To the upside, bullish forces may propel the pair towards its recent reversal point of 0.8645. Conquering this barricade, the price might ascend to challenge the inside swing low of 0.8672. An upside violation of the latter could open the door for the 16-month high of 0.8720.
Overall, EURGBP has been exhibiting signs of strength lately but has not yet managed to totally erase its short-term decline. For that scenario to materialize, the price needs to initially jump above the 0.8645 ceiling.
면책 조항: 본 게시글에 표현된 견해는 전적으로 작성자의 견해이며 Followme의 공식 입장을 대변하지 않습니다. Followme는 제공된 정보의 정확성, 완전성 또는 신뢰성에 대해 책임을 지지 않으며, 서면으로 명시적으로 언급되지 않는 한 해당 내용을 기반으로 취해진 어떠한 조치에 대해서도 책임을 지지 않습니다.

더 오래된 의견은 없습니다. 소파를 가장 먼저 잡으십시오.