


Since the COT report comes out weekly, its usefulness as a market sentiment indicator would be more suitable for longer-term trades.
The question you may be asking now is this:
How the heck do you turn all that “big giant gobbled-up block of text” into a sentiment-based indicator that will help you grab some pips?!
One way to use the COT report in your trading is to find extreme net long or net short positions.
Finding these positions may signal that a market reversal is just around the corner because if everyone is long a currency, who is left to buy?
No one.
And if everyone is short a currency, who is left to sell?
What’s that?
Pretty quiet…
Yeah, that’s right. NO ONE.
One analogy to keep in mind is to imagine driving down a road and hitting a dead end. What happens if you hit that dead end?
You can’t keep going since there’s no more road ahead. The only thing to do is to turn back.
Let’s take a look at this chart of the EUR/USD:
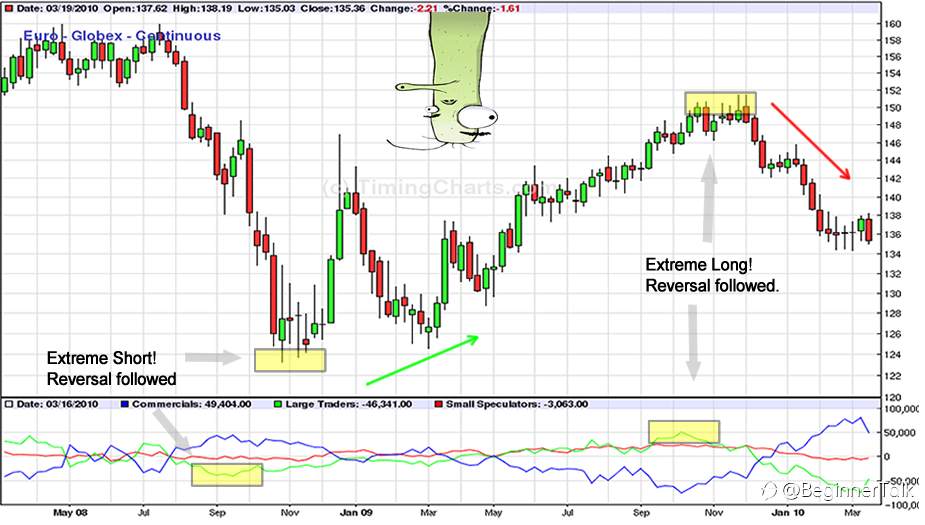
On the top half, we’ve got the price action of EUR/USD going on. At the same time, on the bottom half, we’ve got data on the long and short positions of EUR futures, divided into three categories:
- Commercial traders (blue)
- Large Non-commercial (green)
- Small non-commercial (red)
Ignore the commercial positions for now, since those are mainly for hedging while small retail traders aren’t relevant.
Let’s take a look at what happened mid-way through 2008. As you can see, EUR/USD made a steady decline from July to September.
As the value of the net short positions of non-commercial traders (the green line) dropped, so did EUR/USD.
In the middle of September, net short positions hit an extreme of 45,650. Soon after, investors started to buy back EUR futures.
Meanwhile, EUR/USD rose sharply from about 1.2400 to a high near 1.4700!
Over the next year, the net value of EUR futures position gradually turned positive. As expected, EUR/USD eventually followed suit, even hitting a new high around 1.5100.
In early October 2009, EUR futures net long positions hit an extreme of 51,000 before reversing. Shortly after, EUR/USD began to decline as well.
Holy Guacamole! Just by using the COT as an indicator, you could have caught two crazy moves from October 2008 to January 2009 and November 2009 to March 2010.
The first was in mid-September 2009.If you had seen that speculative traders’ short positions were at extreme levels, you could have bought EUR/USD at around 1.2300.
This would have resulted in almost a 2,000-pip gain in a matter of a few months!
Now, if you had also seen that net long positions were at an extreme in November 2009, you would have had sold EUR/USD and you could have grabbed about 1,500 pips!
With those two moves, by using the COT report as a market sentiment reversal indicator, you could have grabbed a total of 3,500 pips. Pretty nifty, eh?
Reprinted from Babypips, the copyright all reserved by the original author.
면책 조항: 본 게시글에 표현된 견해는 전적으로 작성자의 견해이며 Followme의 공식 입장을 대변하지 않습니다. Followme는 제공된 정보의 정확성, 완전성 또는 신뢰성에 대해 책임을 지지 않으며, 서면으로 명시적으로 언급되지 않는 한 해당 내용을 기반으로 취해진 어떠한 조치에 대해서도 책임을 지지 않습니다.

더 오래된 의견은 없습니다. 소파를 가장 먼저 잡으십시오.